TrkB regulates neocortex formation through the Shc/PLCgamma-mediated control of neuronal migration - PubMed (original) (raw)
TrkB regulates neocortex formation through the Shc/PLCgamma-mediated control of neuronal migration
Diego L Medina et al. EMBO J. 2004.
Abstract
The generation of complex neuronal structures, such as the neocortex, requires accurate positioning of neurons and glia within the structure, followed by differentiation, formation of neuronal connections, and myelination. To understand the importance of TrkB signaling during these events, we have used conditional and knockin mutagenesis of the TrkB neurotrophin receptor, and we now show that this tyrosine kinase receptor, through docking sites for the Shc/FRS2 adaptors and phospholipase Cgamma (PLCgamma), coordinates these events in the cerebral cortex by (1) controlling cortical stratification through the timing of neuronal migration during cortex formation, and (2) regulating both neuronal and oligodendrocyte differentiation. These results provide genetic evidence that TrkB regulates important functions throughout the formation of the cerebral cortex via recruitment of the Shc/FRS2 adaptors and PLCgamma.
Figures
Figure 1
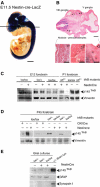
Analysis of NesCre transgenic line and gp145TrkB protein removal. (A, B) Spatial pattern of Cre activity. (A) E11.5 embryo double transgenic: lox-lacZ; NesCre mice stained for β-galactosidase activity. (B) Horizontal sections (anterior right) showing the VIII (*1), the V (*2), and the (*3; IX and X, respectively) peripheral ganglia. (C–E) Western blot analysis of gp145TrkB removal in forebrains of E12, and P1 trkB lox/+ and trkB lox/lox mice, either in the absence (−) or presence (+) of the NesCre transgene (C), in forebrains of P45 controls, trkBNesCre, or trkB lox/lox mice expressing the CKIICre transgene (D), blots were reprobed with anti-vimentin Ab to control for the protein levels, and in astrocyte cultures prepared from brains of P4 control or trkBNesCre mice. These cultures were positive for the astrocyte-specific marker, GFAP, and negative for the neuronal-specific marker, Synapsin I. Also note that, in panel (D), gp145TrkB protein is undetectable in trkBNesCre, whereas residual signal is observed in trkBCaMKIICre mice, as described previously (Minichiello et al, 1999). Scale bars: (A), 1 mm; (B), 400 μm; inset, 150 μm.
Figure 2
Cortical cell migration in trkBNesCre mice. (A–D) Comparable sagittal sections from the Soms cortex stained with anti-BrdU Ab. Cells labeled either at E12.5 (A,B) or at E14.5 (C, D) with BrdU were analyzed at E18.5. (E, F) Quantitative analysis of cortical BrdU-positive cells in trkBNesCre mice and littermate controls labeled either at E12.5 (E) or E14.5 (F) and analyzed at E18.5. (G, H) Cajal-Retzius cells in the Soms cortices of control (G) and trkBNesCre newborn mice (H) identified by double IMF with Abs against calretinin and reelin. **Statistically significant. Scale bars: (A–D), 100 μm; (G, H), 50 μm.
Figure 3
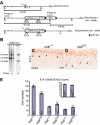
Cortical neuron migration is dependent on the Shc and pLCγ sites of TrkB. (A) Schematic diagram of +/+ trkB locus and mutant alleles. * indicates the point mutation introduced at the Shc and PLCγ sites (*F515, *F816). (B) Southern blot analysis of _Nco_I digests of genomic DNA prepared from neo-resistant (trkBD/+) and +/+ Es cell clones. (C, D) Delayed migration of neurons in the Soms cortex of E18.5 trkB D/D mutants compared to control littermate, as revealed by the BrdU staining of cells labeled at E14.5. (E) Quantitative analysis of BrdU-positive cells in trkB D/D and control mice labeled at E14.5 and analysed at E18.5. Scale bar (C, D), 50 μm.
Figure 4
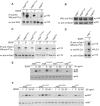
Signaling downstream of mutant TrkB receptors. (A, B) Autophosphorylation and expression levels of TrkB mutant receptors in primary neurons. Cell lysates of cortical neurons derived from either trkB WT/WT control or trkB PLC/PLC and trkB D/D mutants were either left untreated (−) or BDNF stimulated for 1′, immunoprecipitated with anti-Trk Abs followed by IB with anti-pTyr Abs. The blot was reprobed with anti-TrkB Abs to visualize TrkB levels (A). Untreated (−) cell lysates were subjected to SDS–PAGE, followed by IB with TrkB Abs to visualize TrkB levels (B). (C) Tyrosine phosphorylation of Gab1 in the different TrkB mutant and control cortical neurons upon BDNF stimulation. (D) Recruitment of Gab1 to the PLCγ site of TrkB upon BDNF stimulation. (E, F) Time course of MAPK and AKT phosphorylation upon BDNF stimulation of control and mutant primary neurons. Cell lysates were subjected to SDS–PAGE, followed by IB with Abs against the phosphorylated forms of p42 and p44 ERKs (E) or AKT (F). Blots were reprobed with Abs against p44 or AKT, respectively, to control for loading.
Figure 5
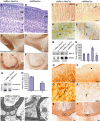
Neocortical development in trkBNesCre mice. (A, B) Coronal sections of 28-week-old brains of trkBNesCre and controls stained with Cresyl violet. (C–F) Sagital sections of control and mutant mice stained with anti-PARV Ab. (G, H) Analysis of PARV protein levels in forebrain lysates from control and trkBNesCre mice. To control for loading, the blot was reprobed with anti-synapsin Abs (G, lower panel). (H) Densitometric analyses of PARV levels in the forebrain of trkBNesCre compared to control mice (H, lane 2 compared with control lane 1), **P<0.002. (I–L) MAP2 IMS in trkBNesCre cortices (J, L) compared to controls (I, K); arrows in (J, L) indicate the apparent fasciculation of dendrites in trkBNesCre and arrowhead in (L) indicates reduced staining of MAP2 in cell bodies of trkBNesCre compared to controls (K). (M, N) Analysis of MAP-2 protein levels in either cerebellum or cortical lysates of control and trkBNesCre mice. To control for loading, the blot was reprobed with anti-NF200 Abs (M, lower panel). (N) Densitometric analyses of MAP2 levels in the cortex of trkBNesCre compared to control mice (N, lane 4 compared with control lane 3), **P<0.01, and in the cerebellum of trkBNesCre compared to control mice (N, lane 2 compared with control lane 1), _P_=0.9. (O–R) OL differentiation. Brain sections from control (O–Q) and trkBNesCre mice (P–R) immunostained with anti-CNPase Abs. (S, T) Immunoassays of brain sections using anti-MBP Abs reveal decreased staining and size of the CC in trkBNesCre (T) compared to control mice (S). (U, V) Ultrastructure of myelinated axons in the CC revealing reduced myelin sheaths and myelin thickness in trkBNescre (V) compared to controls (U) (indicated by an arrow). Scale bars: (A–F), 200 μm; (I, J), 100 μm; (K, L), 50 μm; (O, P), 100 μm; (Q, R), 20 μm; (S, T), 100 μm; (U, V), 200 nm.
Figure 6
Functional consequences upon removal of TrkB signaling. (A–D) GFAP IMS of coronal brain sections in trkBNesCre mutant cortices (B, D) compared to control brains (A, C). (E) Levels of IL6 protein in the forebrains of control, trkBCKIICre, and trkBNesCre mice. (F, G) IMS for c-Fos expression and (H, I) double IMF using GFAP and c-Fos Abs in cortices of trkBNesCre and control mice. (J–O) IMF analysis of inhibitory and excitatory neurotransmitters in Soms cortices of trkBNesCre and control mice using Abs against GAD67 (J, K), GABA (L, M), and glutamate (N, O). Scale bars: (A, B), 200 μm; (C, D), 100 μm; (F, G), 200 μm: (H–O), 50 μm.
Figure 7
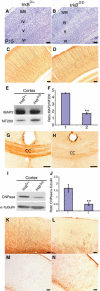
Differentiation of neurons and glia is also mediated through from the Shc and pLCγ sites of TrkB. (A, B) Cresyl violet staining of Soms cortices of trkB D/D and control mice. (C–L) Altered neuronal and OL differentiation in trkB D/D mutants. (C, D) MAP-2 IMS in Soms cortices of trkB D/D and controls at P15. (E) Representative western blot of MAP2 levels in P17 trkB D/D and littermate control cortices. To control for protein loading, blots were reprobed with anti-NF200 Abs. (F) Densitometric analyses of MAP2 levels in the cortex of trkB D/D mice compared to controls. **_P_=0.003. (G, H) CNPase IMS in the CC at P14 (G, H), and MBP in the cortex at P17 (K, L) of trkB D/D and controls. (I) Representative western blot of CNPase expression in P17 trkB D/D and control brains. To control for loading, blots were reprobed with anti-α-tubulin Abs. (J) Densitometric analyses of CNPase levels in the cortex of trkB D/D mice compared to controls. **_P_=0.002. (M, N) GFAP IMS in the Soms cortex of trkB D/D mice compared to controls at P15. Scale bars: (A–D, F, G, J, K, N–Q), 100 μm.
Figure 8
Model: removal of TrkB signaling during neocortical development affects neuronal stratification. (A) Neuronal stratification in different cortical layers of murine cortex (between E11 and E17) depends on the date of neuronal birth and proper migration. (B) Absence of TrkB signaling during cortical development causes a delay in neuronal migration, thereby altering neuronal stratification.
Similar articles
- Mechanism of TrkB-mediated hippocampal long-term potentiation.
Minichiello L, Calella AM, Medina DL, Bonhoeffer T, Klein R, Korte M. Minichiello L, et al. Neuron. 2002 Sep 26;36(1):121-37. doi: 10.1016/s0896-6273(02)00942-x. Neuron. 2002. PMID: 12367511 - Distinct usages of phospholipase C gamma and Shc in intracellular signaling stimulated by neurotrophins.
Yamada M, Numakawa T, Koshimizu H, Tanabe K, Wada K, Koizumi S, Hatanaka H. Yamada M, et al. Brain Res. 2002 Nov 15;955(1-2):183-90. doi: 10.1016/s0006-8993(02)03432-7. Brain Res. 2002. PMID: 12419535 - The TrkB-Shc site signals neuronal survival and local axon growth via MEK and P13-kinase.
Atwal JK, Massie B, Miller FD, Kaplan DR. Atwal JK, et al. Neuron. 2000 Aug;27(2):265-77. doi: 10.1016/s0896-6273(00)00035-0. Neuron. 2000. PMID: 10985347 - Signaling by Kit protein-tyrosine kinase--the stem cell factor receptor.
Roskoski R Jr. Roskoski R Jr. Biochem Biophys Res Commun. 2005 Nov 11;337(1):1-13. doi: 10.1016/j.bbrc.2005.08.055. Biochem Biophys Res Commun. 2005. PMID: 16129412 Review. - Signaling via Shc family adapter proteins.
Ravichandran KS. Ravichandran KS. Oncogene. 2001 Oct 1;20(44):6322-30. doi: 10.1038/sj.onc.1204776. Oncogene. 2001. PMID: 11607835 Review.
Cited by
- New Insights Into the Intricacies of Proneural Gene Regulation in the Embryonic and Adult Cerebral Cortex.
Oproescu AM, Han S, Schuurmans C. Oproescu AM, et al. Front Mol Neurosci. 2021 Feb 15;14:642016. doi: 10.3389/fnmol.2021.642016. eCollection 2021. Front Mol Neurosci. 2021. PMID: 33658912 Free PMC article. Review. - Involvement of a Rac activator,P-Rex1, in neurotrophin-derived signaling and neuronal migration.
Yoshizawa M, Kawauchi T, Sone M, Nishimura YV, Terao M, Chihama K, Nabeshima Y, Hoshino M. Yoshizawa M, et al. J Neurosci. 2005 Apr 27;25(17):4406-19. doi: 10.1523/JNEUROSCI.4955-04.2005. J Neurosci. 2005. PMID: 15858067 Free PMC article. - BDNF+/- mice exhibit deficits in oligodendrocyte lineage cells of the basal forebrain.
Vondran MW, Clinton-Luke P, Honeywell JZ, Dreyfus CF. Vondran MW, et al. Glia. 2010 May;58(7):848-56. doi: 10.1002/glia.20969. Glia. 2010. PMID: 20091777 Free PMC article. - Neurotrophin/Trk receptor signaling mediates C/EBPalpha, -beta and NeuroD recruitment to immediate-early gene promoters in neuronal cells and requires C/EBPs to induce immediate-early gene transcription.
Calella AM, Nerlov C, Lopez RG, Sciarretta C, von Bohlen und Halbach O, Bereshchenko O, Minichiello L. Calella AM, et al. Neural Dev. 2007 Jan 25;2:4. doi: 10.1186/1749-8104-2-4. Neural Dev. 2007. PMID: 17254333 Free PMC article. - Variant brain-derived neurotrophic factor (Val66Met) alters adult olfactory bulb neurogenesis and spontaneous olfactory discrimination.
Bath KG, Mandairon N, Jing D, Rajagopal R, Kapoor R, Chen ZY, Khan T, Proenca CC, Kraemer R, Cleland TA, Hempstead BL, Chao MV, Lee FS. Bath KG, et al. J Neurosci. 2008 Mar 5;28(10):2383-93. doi: 10.1523/JNEUROSCI.4387-07.2008. J Neurosci. 2008. PMID: 18322085 Free PMC article.
References
- Bibel M, Barde YA (2000) Neurotrophins: key regulators of cell fate and cell shape in the vertebrate nervous system. Genes Dev 14: 2919–2937 - PubMed
- Borghesani P, Peyrin J, Klein R, Rubin J, Carter A, Schwartz P, Luster A, Corfas G, Segal R (2002) BDNF stimulates migration of cerebellar granule cells. Development 129: 1435–1442 - PubMed
- Climent E, Sancho-Tello M, Minana R, Barettino D, Guerri C (2000) Astrocytes in culture express the full-length Trk-B receptor and respond to brain derived neurotrophic factor by changing intracellular calcium levels: effect of ethanol exposure in rats. Neurosci Lett 288: 53–56 - PubMed
Publication types
MeSH terms
Substances
LinkOut - more resources
Full Text Sources
Other Literature Sources
Molecular Biology Databases
Miscellaneous
