Long branch attraction, taxon sampling, and the earliest angiosperms: Amborella or monocots? - PubMed (original) (raw)
Long branch attraction, taxon sampling, and the earliest angiosperms: Amborella or monocots?
Sasa Stefanović et al. BMC Evol Biol. 2004.
Abstract
Background: Numerous studies, using in aggregate some 28 genes, have achieved a consensus in recognizing three groups of plants, including Amborella, as comprising the basal-most grade of all other angiosperms. A major exception is the recent study by Goremykin et al. (2003; Mol. Biol. Evol. 20:1499-1505), whose analyses of 61 genes from 13 sequenced chloroplast genomes of land plants nearly always found 100% support for monocots as the deepest angiosperms relative to Amborella, Calycanthus, and eudicots. We hypothesized that this conflict reflects a misrooting of angiosperms resulting from inadequate taxon sampling, inappropriate phylogenetic methodology, and rapid evolution in the grass lineage used to represent monocots.
Results: We used two main approaches to test this hypothesis. First, we sequenced a large number of chloroplast genes from the monocot Acorus and added these plus previously sequenced Acorus genes to the Goremykin et al. (2003) dataset in order to explore the effects of altered monocot sampling under the same analytical conditions used in their study. With Acorus alone representing monocots, strongly supported Amborella-sister trees were obtained in all maximum likelihood and parsimony analyses, and in some distance-based analyses. Trees with both Acorus and grasses gave either a well-supported Amborella-sister topology or else a highly unlikely topology with 100% support for grasses-sister and paraphyly of monocots (i.e., Acorus sister to "dicots" rather than to grasses). Second, we reanalyzed the Goremykin et al. (2003) dataset focusing on methods designed to account for rate heterogeneity. These analyses supported an Amborella-sister hypothesis, with bootstrap support values often conflicting strongly with cognate analyses performed without allowing for rate heterogeneity. In addition, we carried out a limited set of analyses that included the chloroplast genome of Nymphaea, whose position as a basal angiosperm was also, and very recently, challenged.
Conclusions: These analyses show that Amborella (or Amborella plus Nymphaea), but not monocots, is the sister group of all other angiosperms among this limited set of taxa and that the grasses-sister topology is a long-branch-attraction artifact leading to incorrect rooting of angiosperms. These results highlight the danger of having lots of characters but too few and, especially, molecularly divergent taxa, a situation long recognized as potentially producing strongly misleading molecular trees. They also emphasize the importance in phylogenetic analysis of using appropriate evolutionary models.
Figures
Figure 1
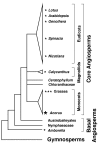
Current consensus hypothesis of angiosperm relationships. Tree topology is based on [42, 91] and references in Table 1. Small asterisks indicate the general phylogenetic position of the ten angiosperms (generic names shown for all but the three grasses) examined by Goremykin et al. [19]. The large asterisk indicates the addition in this study of the early-arising monocot Acorus to the Goremykin et al. [19] dataset. The height of the triangles reflects the relative number of species in eudicots (~175,000 species), monocots (~70,000), and magnoliids (~9,000) as estimated by Judd et al. [18] and Walter Judd (personal communication). The other five angiosperm groups shown contain only between 1 and ~100 species.
Figure 2
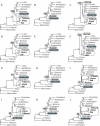
The effect of changing sampling of monocots as a function ofphylogenetic method. Analysis of the 61-gene data matrix using: Rows A-C, DNA parsimony; D-F, protein parsimony; G-I DNA ML HKY85 with no rate categories; J-L, RY-coded DNA parsimony. The first column of trees is with the Goremykin et al. [19] taxon sampling (grasses, but not Acorus), the second is with Acorus but not grasses, and the third is with both grasses and Acorus. All analyses used the first- and second-position matrix, either with or without the addition of Acorus as explained in Methods. Trees J-L use the same matrices, but with the nucleotides RY-coded.
Figure 3
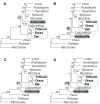
Neighbor joining analyses using different evolutionary models and/or taxon sampling. Distance matrices were calculated from the first- and second-position matrix of Goremykin et al. [19] using (A) the K2P model, (B) the ML HKY85 model with four gamma-distributed rate categories and parameters estimated from the corresponding ML analysis, and (C) the K2P model with Acorus added to the first- and second-position matrix as described in Methods.
Figure 4
Maximum likelihood analyses using different evolutionary models. Trees A-C were calculated using the first- and second-position Goremykin et al. [19] matrix. Tree D was calculated using all three codon positions. All trees were built using ML with the HKY85 model and the following treatments of rate heterogeneity: A. No rate categories. B. Four gamma-distributed rate categories. C. Estimated proportion of invariant sites (no gamma rate categories). D. No rate categories (all three positions). Parameters were estimated separately for each analysis as described in Methods.
Figure 5
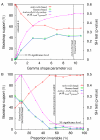
Bootstrap support and the SH-test p-value for the _Amborella_-sister or grasses-sister topologies as a function of (A) the gamma distribution α parameter value or (B) the proportion of invariable sites. The left vertical line in A and right line in B indicate the rate-heterogeneity parameter estimated from the data. The right vertical line in A and left line in B indicate the boundary where the topology of the best tree transitions between _Amborella_-sister and grasses-sister. All analyses were performed using the 61-gene first- and second-position matrix of Goremykin et al. [19] and the ML HKY85 model with the α parameter or proportion of invariant sites indicated on the X-axis. The transition-transversion parameter was estimated for each specified rate-heterogeneity parameter. p(Δ|LAmb-Lgrasses|) signifies the SH-test p-value for the difference between the likelihood scores of the two topologies. Bootstrap searches and SH-tests were performed as described in Methods.
Figure 6
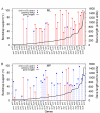
Support for _Amborella_-sister or grasses-sister from the 61 chloroplast genes analyzed individually. A. ML HKY85 analyses with four gamma-distributed rate categories. Parameter estimates were calculated individually for each gene in a manner analogous to that performed on the concatenated dataset. B. MP analyses. All three codon positions are included in all analyses shown in both figures. Solid red lines correspond to _Amborella_-sister and dashed blue lines to grasses-sister topologies.
Figure 7
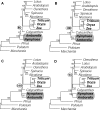
Inclusion of Nymphaea in analyses that account for rate heterogeneity. A. ML HKY85 with no rate categories (cf. Fig. 4A). B. ML HYK85 with four gamma-distributed rate categories (cf. Fig. 4B). C. ML with estimated proportion of invariant sites (no gamma rate categories; cf. Fig. 4C). D. NJ using a ML HKY85 model with four gamma-distributed rate categories to calculate distances (cf. Fig. 3B). All analyses used first- and second-positions only.
Figure 8
Competing hypotheses for the rooting of angiosperms showing the same underlying angiosperm topology when outgroups are excluded. A. Rooting within monocots (Mono), on the branch between grasses and all other angiosperms (see Fig. 2C, whose BS values are shown here, and also Fig. 2F; also see Goremykin et al. [19]). B. Unrooted network, with arrow showing alternative rootings as in A and C. C. Canonical rooting on the branch between Amborella and the rest of angiosperms (see Fig. 2I, whose BS values are shown here, and also Fig. 2L). We emphasize that 100% BS was obtained for _Amborella_-sister and for monocot monophyly (compared to 79% and 78% in C) using ML methods that allow for site-to-site rate heterogeneity (e.g., Additional files 1–3).
Similar articles
- Identifying the basal angiosperm node in chloroplast genome phylogenies: sampling one's way out of the Felsenstein zone.
Leebens-Mack J, Raubeson LA, Cui L, Kuehl JV, Fourcade MH, Chumley TW, Boore JL, Jansen RK, depamphilis CW. Leebens-Mack J, et al. Mol Biol Evol. 2005 Oct;22(10):1948-63. doi: 10.1093/molbev/msi191. Epub 2005 Jun 8. Mol Biol Evol. 2005. PMID: 15944438 - Amborella not a "basal angiosperm"? Not so fast.
Soltis DE, Soltis PS. Soltis DE, et al. Am J Bot. 2004 Jun;91(6):997-1001. doi: 10.3732/ajb.91.6.997. Am J Bot. 2004. PMID: 21653455 - Another look at the root of the angiosperms reveals a familiar tale.
Drew BT, Ruhfel BR, Smith SA, Moore MJ, Briggs BG, Gitzendanner MA, Soltis PS, Soltis DE. Drew BT, et al. Syst Biol. 2014 May;63(3):368-82. doi: 10.1093/sysbio/syt108. Epub 2014 Jan 3. Syst Biol. 2014. PMID: 24391149 - Nuclear phylogenomics of angiosperms and insights into their relationships and evolution.
Zhang G, Ma H. Zhang G, et al. J Integr Plant Biol. 2024 Mar;66(3):546-578. doi: 10.1111/jipb.13609. Epub 2024 Jan 30. J Integr Plant Biol. 2024. PMID: 38289011 Review. - Genome-scale data, angiosperm relationships, and "ending incongruence": a cautionary tale in phylogenetics.
Soltis DE, Albert VA, Savolainen V, Hilu K, Qiu YL, Chase MW, Farris JS, Stefanović S, Rice DW, Palmer JD, Soltis PS. Soltis DE, et al. Trends Plant Sci. 2004 Oct;9(10):477-83. doi: 10.1016/j.tplants.2004.08.008. Trends Plant Sci. 2004. PMID: 15465682 Review.
Cited by
- Comparative chloroplast genomics: analyses including new sequences from the angiosperms Nuphar advena and Ranunculus macranthus.
Raubeson LA, Peery R, Chumley TW, Dziubek C, Fourcade HM, Boore JL, Jansen RK. Raubeson LA, et al. BMC Genomics. 2007 Jun 15;8:174. doi: 10.1186/1471-2164-8-174. BMC Genomics. 2007. PMID: 17573971 Free PMC article. - Resolving the Early Divergence Pattern of Teleost Fish Using Genome-Scale Data.
Takezaki N. Takezaki N. Genome Biol Evol. 2021 May 7;13(5):evab052. doi: 10.1093/gbe/evab052. Genome Biol Evol. 2021. PMID: 33739405 Free PMC article. - Gene Expression Maps in Plants: Current State and Prospects.
Klepikova AV, Penin AA. Klepikova AV, et al. Plants (Basel). 2019 Aug 28;8(9):309. doi: 10.3390/plants8090309. Plants (Basel). 2019. PMID: 31466308 Free PMC article. Review. - MitoCOGs: clusters of orthologous genes from mitochondria and implications for the evolution of eukaryotes.
Kannan S, Rogozin IB, Koonin EV. Kannan S, et al. BMC Evol Biol. 2014 Nov 25;14:237. doi: 10.1186/s12862-014-0237-5. BMC Evol Biol. 2014. PMID: 25421434 Free PMC article.
References
- Qiu Y-L JLee, Bernasconi-Quadroni F, Soltis DE, Soltis PS, Zanis MJ, Zimmer EA, Chen Z, Savolainen V, Chase MW. Phylogeny of basal angiosperms: analyses of five genes from three genomes. Int J Plant Sci. 2000;161:S3–S27. doi: 10.1086/317584. - DOI
Publication types
MeSH terms
Substances
LinkOut - more resources
Full Text Sources
