Insulin receptor substrate 2 plays a crucial role in beta cells and the hypothalamus - PubMed (original) (raw)
. 2004 Oct;114(7):917-27.
doi: 10.1172/JCI21484.
Yasuo Terauchi, Kazuyuki Tobe, Wataru Yano, Ryo Suzuki, Kohjiro Ueki, Iseki Takamoto, Hidemi Satoh, Toshiyuki Maki, Tetsuya Kubota, Masao Moroi, Miki Okada-Iwabu, Osamu Ezaki, Ryozo Nagai, Yoichi Ueta, Takashi Kadowaki, Tetsuo Noda
Affiliations
- PMID: 15467830
- PMCID: PMC518663
- DOI: 10.1172/JCI21484
Insulin receptor substrate 2 plays a crucial role in beta cells and the hypothalamus
Naoto Kubota et al. J Clin Invest. 2004 Oct.
Abstract
We previously demonstrated that insulin receptor substrate 2 (Irs2) KO mice develop diabetes associated with hepatic insulin resistance, lack of compensatory beta cell hyperplasia, and leptin resistance. To more precisely determine the roles of Irs2 in beta cells and the hypothalamus, we generated beta cell-specific Irs2 KO and hypothalamus-specific Irs2 knockdown (betaHT-IRS2) mice. Expression of Irs2 mRNA was reduced by approximately 90% in pancreatic islets and was markedly reduced in the arcuate nucleus of the hypothalamus. By contrast, Irs2 expression in liver, muscle, and adipose tissue of betaHT-IRS2 mice was indistinguishable from that of control mice. The betaHT-IRS2 mice displayed obesity and leptin resistance. At 4 weeks of age, the betaHT-IRS2 mice showed normal insulin sensitivity, but at 8 and 12 weeks, they were insulin resistant with progressive obesity. Despite their normal insulin sensitivity at 8 weeks with caloric restriction, the betaHT-IRS2 mice exhibited glucose intolerance and impaired glucose-induced insulin secretion. beta Cell mass and beta cell proliferation in the betaHT-IRS2 mice were reduced significantly at 8 and 12 weeks but not at 10 days. Insulin secretion, normalized by cell number per islet, was significantly increased at high glucose concentrations in the betaHT-IRS2 mice. We conclude that, in beta cells and the hypothalamus, Irs2 is crucially involved in the regulation of beta cell mass and leptin sensitivity.
Figures
Figure 1
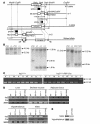
Generation of βHT-IRS2 mice. (A) Schematic representation of the 3 steps in our gene-targeting strategy. (B) Southern blot analysis. Left: _Sac_I-digested ES cell genomic DNA hybridized with probe A. The 4-kb band corresponds to the WT (+) allele, and the 3.2-kb band to the first step of the mutant (neo) allele. Middle: _Spe_I- and _Eco_RV-digested ES cell genomic DNA hybridized with probe B. The 11.8-kb band corresponds to the WT (+) allele, the 2.9-kb band to the (neo) allele, and the 1.6-kb band to the second step of the mutant (Δ) allele. Right: _Hind_III-digested ES cell genomic DNA hybridized with probe C. The 17.3-kb band corresponds to the WT (+) allele, the 15.2-kb band to the mutant (Δ) allele, and the 6-kb band to final step of the mutant (neoΔ) allele. (C) PCR analysis of genomic DNA to detect Cre-mediated recombination. K, kidney; L, liver; M, muscle; A, adipose tissue; S, spleen; HT, hypothalamus; H, heart; Lu, lung; I, islet. (D) RT-PCR of Cre and Irs2 expression in liver, skeletal muscle, adipose tissue, hypothalami, and pancreatic islets of WT, RIP-Cre, IRS2lox/lox, and IRS2lox/lox/RIP-Cre (βHT-IRS2) mice. (E) Western blot analysis of Irs2 in pancreatic islets (upper panel) and hypothalami (lower panel) from control and βHT-IRS2 mice.
Figure 2
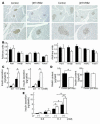
βHT-IRS2 mice showed leptin resistance. (A) Body weights of control and βHT-IRS2 mice. Values are means ± SE of data obtained from the analysis of control (filled squares, n = 10) and βHT-IRS2 mice (open circles, n = 11). (B) WAT mass of epididymal fat pads of control and βHT-IRS2 mice at 12 weeks. Values are means ± SE of data obtained from the analysis of control (black bar, n = 5) and βHT-IRS2 mice (white bar, n = 9). (C) Fasting serum leptin levels of control and βHT-IRS2 mice at 8 weeks. Values are means ± SE of data obtained from the analysis of control (black bar, n = 10) and βHT-IRS2 mice (white bar, n = 11). (D) Leptin-mediated suppression of food intake (left) and body weight (right) at 8 weeks. Baseline food intake was measured during PBS injection. Values are means ± SE of data obtained from the analysis of control (black bar, n = 9) and βHT-IRS2 mice (white bar, n = 7). (E) In situ hybridization of the leptin receptor and Irs2 in hypothalami from control and βHT-IRS2 mice. Scale bar represents 1 mm. (F) Insulin-stimulated phosphorylation of Akt (top) and leptin-stimulated phosphorylation of Stat3 (bottom). Upper panels: lysates from untreated and insulin-treated mice were immunoblotted for anti_phospho-Akt (pAkt) and anti-Akt. Lower panels: lysates from untreated and leptin-treated mice were immunoblotted for anti_phospho-Stat3 (pStat3) and anti-Stat3. In graphs, white bars represent insulin- (left) or leptin- (right) stimulated phosphorylation. Data (means ± SE) are representative of at least 3 independent experiments. *P < 0.05; **P < 0.01.
Figure 3
βHT-IRS2 mice showed insulin resistance, glucose intolerance, and dyslipidemia. (A) Fasting glucose (left) and insulin levels (right) of control and βHT-IRS2 mice at 8 weeks. Values are means ± SE of data obtained from the analysis of control (black bar, n = 12) and βHT-IRS2 mice (white bar, n = 13). (B) Random blood glucose levels of control and βHT-IRS2 mice at 8 and 12 weeks. Values are means ± SE of data obtained from the analysis of control (black bar, n = 12) and βHT-IRS2 mice (white bar, n = 13). (C) Insulin tolerance tests of control and βHT-IRS2 mice at 4 weeks (upper left), 8 weeks (upper right), 12 weeks (lower left), and 8 weeks with 4-week caloric restriction (lower right). Values are means ± SE of data obtained from the analysis of control (filled squares, n = 8_14) and βHT-IRS2 mice (open circles, n = 9_14). (D) Oral glucose tolerance tests of control and βHT-IRS2 mice at 8 weeks with caloric restriction (upper) and without caloric restriction (lower). Values are means ± SE of data obtained from the analysis of control (filled squares, n = 8_10) and βHT-IRS2 mice (open circles, n = 9_10). Blood glucose (left) and plasma insulin levels (right) were measured at the times indicated. (E) Serum total cholesterol (left), triglyceride (middle), and FFA (right) levels of the control and βHT-IRS2 mice at 8 weeks. Values are means ± SE of data obtained from the analysis of control (black bar, n = 10) and βHT-IRS2 mice (white bar, n = 10). *P < 0.05; **P < 0.01.
Figure 4
β Cell mass and β cell proliferation were reduced in βHT-IRS2 mice at 8 weeks, regardless of caloric restriction. (A) Histological analysis of pancreatic islets (upper) and quantitation of β cell mass (lower) in control and βHT-IRS2 mice at 8 weeks with caloric restriction (left panels) and without caloric restriction (right panels). Representative islets viewed on a computer monitor are shown. Results are shown as area of β cell mass. Values are means ± SE of data obtained from the analysis of control (black bars, n = 5) and βHT-IRS2 mice (white bars, n = 5). Original magnification, ×40 (upper panels); ×100 (lower panels). (B) BrdU incorporation into β cell nuclei of control and βHT-IRS2 mice at 8 weeks with caloric restriction (left panels) and without caloric restriction (right panels). Results are shown as percentages of cells that incorporated BrdU. Values are means ± SE of data obtained from the analysis of control (black bars, number of islets = 192_197) and βHT-IRS2 mice (white bars, number of islets = 211_232). Original magnification, ×100 (upper panels); ×400 (lower panels). Arrowheads indicate cells that have incorporated BrdU. *P < 0.05.
Figure 5
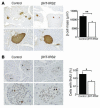
β Cell mass and β cell proliferation were reduced in βHT-IRS2 mice at 12 weeks. (A) Histological analysis of pancreatic islets (left) and quantitation of β cell mass (right) in control and βHT-IRS2 mice at 12 weeks. Representative islets viewed on a computer monitor are shown. Results are shown as area of β cell mass. Values are means ± SE of data obtained from the analysis of control (black bar, n = 5) and βHT-IRS2 mice (white bar, n = 5). Original magnification, ×40 (upper panels); ×100 (lower panels). (B) BrdU incorporation into β cell nuclei of control and βHT-IRS2 mice. Results are shown as percentages of cells that incorporated BrdU. Values are means ± SE of data obtained from the analysis of control (black bar, number of islets = 280) and βHT-IRS2 mice (white bar, number of islets = 284). Original magnification, ×100 (upper panels); ×400 (lower panels). Arrowheads indicate cells that have incorporated BrdU. *P < 0.05.
Figure 6
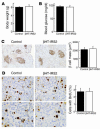
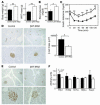
β Cell mass and β cell proliferation were not reduced in βHT-IRS2 mice at 10 days. (A) Body weights of control and βHT-IRS2 mice. Values are means ± SE of data obtained from the analysis of control (black bar, n = 4) and βHT-IRS2 mice (white bar, n = 4). (B) Random blood glucose levels of control and βHT-IRS2 mice. Values are means ± SE of data obtained from the analysis of control (black bar, n = 4) and βHT-IRS2 mice (white bar, n = 4). (C) Histological analysis of pancreatic islets (left) and quantitation of β cell mass (right) in control and βHT-IRS2 mice at 10 days. Representative islets viewed on a computer monitor are shown. Results are shown as area of β cell mass. Values are means ± SE of data obtained from the analysis of control (black bar, n = 4) and βHT-IRS2 mice (white bar, n = 4). Original magnification, ×200. (D) BrdU incorporation into β cell nuclei of control and βHT-IRS2 mice. Results are shown as the percentage of cells that had incorporated BrdU. Values are means ± SE of data obtained from the analysis of control (black bar, number of islets = 67) and βHT-IRS2 mice (white bar, number of islets = 58). Original magnification, ×400 (upper panels); ×600 (lower panels). Arrowheads indicate cells that have incorporated BrdU.
Figure 7
Normal expression of Pdx1, normal insulin contents and increased insulin secretion in βHT-IRS2 mice. (A) Immunohistochemical study of Pdx1 in control and βHT-IRS2 mice at 8 weeks (left panels) and at 12 weeks (right panels). Representative islets viewed on a computer monitor are shown. Original magnification ×100 (upper panels); ×200 (lower panels). (B) Taqman PCR analysis of Pdx1, Hnf1α, Hnf4α, and Foxo1 mRNA levels, normalized to β-actin mRNA levels in control (black bars) and βHT-IRS2 mice (white bars) at 8 weeks (left) and at 12 weeks (right). (C) Insulin secretion per islet (left) and insulin secretion normalized by cell number per islet (right) during static incubation of islets from control and βHT-IRS2 mice for 1 hour at the glucose levels indicated. Values are expressed as means ± SE (n = 5). Data were obtained in 3 independent experiments. (D) Insulin content per islet (left) and insulin content normalized by cell number per islet (right) in control and βHT-IRS2 mice. Values are expressed as means ± SE (n = 5). Data were obtained in 3 independent experiments. (E) Insulin secretion per islet during static incubation of islets from control and βHT-IRS2 mice for 1 hour at the glucose levels indicated with and without LY294002 (LY). Data were obtained in 3 independent experiments. *P < 0.05.
Figure 8
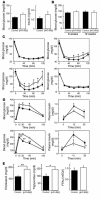
βHT-IRS2 mice on a high-fat diet for 4 weeks, starting from 4 weeks of age. (A) Body weights (left) and WAT mass of epididymal fat pads (right) of control and βHT-IRS2 mice. Values are means ± SE of data obtained from the analysis of control (black bars, n = 7) and βHT-IRS2 mice (white bars, n = 7). (B) Fasting blood glucose levels of control and βHT-IRS2 mice. Values are means ± SE of data obtained from the analysis of control (black bars, n = 7) and βHT-IRS2 mice (white bars, n = 7). (C) Insulin tolerance tests of control and βHT-IRS2 mice. Values are means ± SE of data obtained from the analysis of control (filled squares, n = 7) and βHT-IRS2 mice (open circles, n = 7). (D) Histological analysis of pancreatic islets (left) and quantitation of β cell mass (right) in control and βHT-IRS2 mice. Representative islets viewed on a computer monitor are shown. Results are shown as area of β cell mass. Values are means ± SE of data obtained from the analysis of control (black bar, n = 5) and βHT-IRS2 mice (white bar, n = 5). Original magnification, ×40 (upper panels); ×100 (lower panels). (E) Immunohistochemical study of Pdx1 in control and βHT-IRS2 mice. Representative islets viewed on a computer monitor are shown. Original magnification, ×100 (upper panels); ×200 (lower panels). (F) Taqman PCR analysis of Pdx1, Hnf1α, Hnf4α, and Foxo1 mRNA levels, normalized to β-actin mRNA levels in control (black bars) and βHT-IRS2 mice (white bars). *P < 0.05; **P < 0.01.
Comment in
- J Clin Invest. 114:886.
Similar articles
- Pdx1 restores beta cell function in Irs2 knockout mice.
Kushner JA, Ye J, Schubert M, Burks DJ, Dow MA, Flint CL, Dutta S, Wright CV, Montminy MR, White MF. Kushner JA, et al. J Clin Invest. 2002 May;109(9):1193-201. doi: 10.1172/JCI14439. J Clin Invest. 2002. PMID: 11994408 Free PMC article. - Glucokinase and IRS-2 are required for compensatory beta cell hyperplasia in response to high-fat diet-induced insulin resistance.
Terauchi Y, Takamoto I, Kubota N, Matsui J, Suzuki R, Komeda K, Hara A, Toyoda Y, Miwa I, Aizawa S, Tsutsumi S, Tsubamoto Y, Hashimoto S, Eto K, Nakamura A, Noda M, Tobe K, Aburatani H, Nagai R, Kadowaki T. Terauchi Y, et al. J Clin Invest. 2007 Jan;117(1):246-57. doi: 10.1172/JCI17645. J Clin Invest. 2007. PMID: 17200721 Free PMC article. - Subcellular localization of glucose transporter 4 in the hypothalamic arcuate nucleus of ob/ob mice under basal conditions.
Komori T, Morikawa Y, Tamura S, Doi A, Nanjo K, Senba E. Komori T, et al. Brain Res. 2005 Jul 5;1049(1):34-42. doi: 10.1016/j.brainres.2005.04.079. Brain Res. 2005. PMID: 15925330 - Targeting type 2 diabetes: lessons from a knockout model of insulin receptor substrate 2.
Oliveira JM, Rebuffat SA, Gasa R, Gomis R. Oliveira JM, et al. Can J Physiol Pharmacol. 2014 Aug;92(8):613-20. doi: 10.1139/cjpp-2014-0114. Epub 2014 Jun 3. Can J Physiol Pharmacol. 2014. PMID: 24977713 Review. - Pancreatic beta-cell growth and survival--a role in obesity-linked type 2 diabetes?
Lingohr MK, Buettner R, Rhodes CJ. Lingohr MK, et al. Trends Mol Med. 2002 Aug;8(8):375-84. doi: 10.1016/s1471-4914(02)02377-8. Trends Mol Med. 2002. PMID: 12127723 Review.
Cited by
- Deletion of SOCS7 leads to enhanced insulin action and enlarged islets of Langerhans.
Banks AS, Li J, McKeag L, Hribal ML, Kashiwada M, Accili D, Rothman PB. Banks AS, et al. J Clin Invest. 2005 Sep;115(9):2462-71. doi: 10.1172/JCI23853. Epub 2005 Aug 25. J Clin Invest. 2005. PMID: 16127460 Free PMC article. - Critical roles for the TSC-mTOR pathway in β-cell function.
Mori H, Inoki K, Opland D, Münzberg H, Villanueva EC, Faouzi M, Ikenoue T, Kwiatkowski DJ, Macdougald OA, Myers MG Jr, Guan KL. Mori H, et al. Am J Physiol Endocrinol Metab. 2009 Nov;297(5):E1013-22. doi: 10.1152/ajpendo.00262.2009. Epub 2009 Aug 18. Am J Physiol Endocrinol Metab. 2009. PMID: 19690069 Free PMC article. - Pseudotime Ordering Single-Cell Transcriptomic of β Cells Pancreatic Islets in Health and Type 2 Diabetes.
Bao K, Cui Z, Wang H, Xiao H, Li T, Kong X, Liu T. Bao K, et al. Phenomics. 2021 Oct 19;1(5):199-210. doi: 10.1007/s43657-021-00024-z. eCollection 2021 Oct. Phenomics. 2021. PMID: 36939754 Free PMC article. - Conditional gene targeting in mouse pancreatic ß-Cells: analysis of ectopic Cre transgene expression in the brain.
Wicksteed B, Brissova M, Yan W, Opland DM, Plank JL, Reinert RB, Dickson LM, Tamarina NA, Philipson LH, Shostak A, Bernal-Mizrachi E, Elghazi L, Roe MW, Labosky PA, Myers MG Jr, Gannon M, Powers AC, Dempsey PJ. Wicksteed B, et al. Diabetes. 2010 Dec;59(12):3090-8. doi: 10.2337/db10-0624. Epub 2010 Aug 29. Diabetes. 2010. PMID: 20802254 Free PMC article. - Leptin rapidly improves glucose homeostasis in obese mice by increasing hypothalamic insulin sensitivity.
Koch C, Augustine RA, Steger J, Ganjam GK, Benzler J, Pracht C, Lowe C, Schwartz MW, Shepherd PR, Anderson GM, Grattan DR, Tups A. Koch C, et al. J Neurosci. 2010 Dec 1;30(48):16180-7. doi: 10.1523/JNEUROSCI.3202-10.2010. J Neurosci. 2010. PMID: 21123564 Free PMC article.
References
- White MF. The IRS-signalling system: a network of docking proteins that mediate insulin action. Mol. Cell. Biochem. 1998;182:3–11. - PubMed
- Saltiel AR, Kahn CR. Insulin signalling and the regulation of glucose and lipid metabolism. Nature. 2001;414:799–806. - PubMed
- Nakae J, Kido Y, Accili D. Distinct and overlapping functions of insulin and IGF-I receptors. Endocr. Rev. 2001;22:813–835. - PubMed
Publication types
MeSH terms
Substances
LinkOut - more resources
Full Text Sources
Molecular Biology Databases
Research Materials
