Viral evolution and interferon resistance of hepatitis C virus RNA replication in a cell culture model - PubMed (original) (raw)
Viral evolution and interferon resistance of hepatitis C virus RNA replication in a cell culture model
Rhea Sumpter Jr et al. J Virol. 2004 Nov.
Abstract
Hepatitis C virus (HCV) replicates through an error-prone process that may support the evolution of genetic variants resistant to the host cell antiviral response and interferon (IFN)-based therapy. We evaluated HCV-IFN interactions within a long-term culture system of Huh7 cell lines harboring different variants of an HCV type 1b subgenomic RNA replicon that differed at only two sites within the NS5A-encoding region. A replicon with a K insertion at HCV codon 2040 replicated efficiently and exhibited sequence stability in the absence of host antiviral pressure. In contrast, a replicon with an L2198S point mutation replicated poorly and triggered a cellular response characterized by IFN-beta production and low-level IFN-stimulated gene (ISG) expression. When maintained in long term-culture, the L2198S RNA evolved into a stable high-passage (HP) variant with six additional point mutations throughout the HCV protein-encoding region that enhanced viral replication. The HP RNA transduced Huh7 cells with more than 1,000-fold greater efficiency than its L2198S progenitor or the K2040 sequence. Replication of the HP RNA resisted suppression by IFN-alpha treatment and was associated with virus-directed reduction in host cell expression of ISG56, an antagonist of HCV RNA translation. Accordingly, the HP RNA was retained within polyribosome complexes in vivo that were refractory to IFN-induced disassembly. These results identify ISG56 as a translational control effector of the host response to HCV and provide direct evidence to link this response to viral sequence evolution, ISG regulation, and selection of the IFN-resistant viral phenotype.
Figures
FIG. 1.
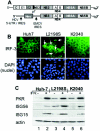
HCV replicon and assessment of protein expression and IRF-3 localization in Huh7 control and HCV replicon cell lines. (A) Schematic structural representation of the full-length HCV genome (top) and the HCV subgenomic RNA replicon (bottom). The regions corresponding to the 5′ NTR-IRES, 3′ NTR, and core (C), envelope (E1 and E2), p7, and NS protein-encoding regions are indicated. Also shown is the position of the encephalomyocarditis virus (EMCV) IRES in the HCV replicon RNA. Amino acid positions refer to the HCV Con1 polyprotein sequence (32). (B) Huh7 control cells (left panel), Huh7-L2198S cells (middle panel) or Huh7-K2040 cells (right panels) cultured on chamber slides were fixed and probed with polyclonal rabbit anti-IRF-3 serum (6) and a fluorescein isothiocyanate-conjugated donkey anti-rabbit secondary antibody (top panels) exactly as previously described (10). Following antibody staining, the nuclei were stained with DAPI (4′,6′-diamidino-2-phenylindole) (bottom panels). IRF-3 and nuclei were visualized by fluorescence microscopy with a Zeiss Axiovert digital imaging microscope in the University of Texas Southwestern Medical Center Pathogen Imaging Facility. The white arrows point to nuclear IRF-3 in Huh7-L2198S cells, which amounted to 5 to 7% of the cells in a given culture. Magnification, ×40. (C) Immunoblot analysis of ISG expression. Huh7 control, Huh7-L2198S, or Huh7-K2040 cells were cultured for 24 h alone (−, lanes 1, 3, and 5) or in the presence of 10 U of IFN-α2a/ml (+, lanes 2, 4, and 6). Twenty micrograms of total cellular protein was then separated on an SDS-10% polyacrylamide gel electrophoresis gel and subjected to immunoblot analysis of PKR, ISG56, and ISG15 protein levels. In this and other immunoblot experiments, we confirmed that equal amounts of protein were loaded in each lane of the gel by stripping the blot and reprobing it with an antiserum to actin (bottom panel).
FIG. 2.
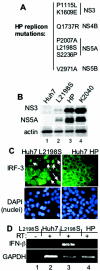
Features of genetically distinct HCV replicons and Huh7 cell lines. (A) Ordered listing of the amino acid changes in the HP replicon polyprotein compared to the prototype Con1 sequence. The numbering is based on the Con1 HCV polyprotein codon position (32), with the positions shown localizing to the corresponding NS protein-encoding region indicated at right. (B) HCV protein levels in extracts from Huh7 (lane 1), Huh7-L2198S (lane 2), Huh7-HP (lane 3), or Huh7-K2040 (lane 4) cells were assessed by resolving 20 μg of total cellular protein by denaturing gel electrophoresis (SDS-10% polyacrylamide gel electrophoresis), followed by immunoblot analysis with an HCV-specific antiserum to detect NS3 and NS5A proteins. The abundance of actin was monitored as an internal control (lower panel). (C) The subcellular localization of IRF-3 in Huh7-L2198S and Huh7-HP cells was determined by anti-IRF-3 immunostaining and immunofluorescence microscopy exactly as described in the legend to Fig. 1B. Nuclei (lower panels) were visualized by DAPI staining of the fixed cells. The white arrows point to cells with the nuclear isoform of IRF-3. (D) IFN-β (top panel) and GAPDH mRNA expression (bottom panel) in total RNA isolated from Huh7-L2198S cells (lanes 1 and 3) or Huh7-HP cells (lanes 2 and 4) was detected by standard RT-PCR assay with primers specific for IFN-β or GAPDH. RT labels above each lane indicate the presence or absence of RT in the reaction mixture.
FIG. 3.
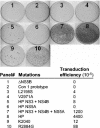
HP adaptive mutations act synergistically to confer increased transduction efficiency of the HCV replicon RNA. The specific adaptive mutations identified in the L2198S, HP, or K2040 HCV replicon were reintroduced into the parental HCV replicon cDNA as described in Materials and Methods. Huh7 cells were transfected with 900 ng of DNA-free in vitro-transcribed replicon RNA plus 100 ng of luciferase poly(A) RNA for monitoring and normalization of transfection efficiency. The numbered panels show the cell colonies that were recovered after 3 weeks of G418 selection and correspond to the average transduction efficiency (derived from triplicate experiments), and the corresponding replicon mutation(s) is listed below the panel set. Transduction efficiency is expressed as the average number of stably transduced cell colonies per 105 cells plated and was controlled for transfection efficiency as determined by the luciferase assay.
FIG. 4.
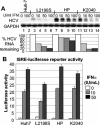
HP mutations associate with IFN-resistant HCV RNA replication independently of defects in IFN signaling to the ISRE. (A) Control Huh7 cells (lanes 1and 2), HCV replicon-bearing Huh7-L2198S cells (lanes 3 to 6), Huh7-HP cells (lanes 7 to 10), or Huh7-K2040 cells (lanes 11 to 14) were cultured in the absence of G418 in medium containing 0, 10, 50, or 100 U of IFN-α2a/ml for 24 h, after which the cells were harvested and extracts were prepared for RNA evaluation. Five micrograms of total RNA was subjected to Northern blot analysis with probes specific for HCV or GAPDH. The relative HCV and GAPDH signal strengths were then quantified by phosphorimager analysis and a HCV/GAPDH RNA ratio for each lane was calculated. The percentage of HCV RNA remaining relative to GAPDH for each IFN dose was determined by dividing the resulting HCV/GAPDH ratio from the IFN-treated samples by the ratio value derived from each untreated control and is expressed in the bar graph as the percent HCV RNA remaining. (B) Control Huh7 cells or replicon-bearing cell lines were transfected in triplicate with a plasmid encoding the ISRE-firefly luciferase reporter construct and a second plasmid encoding the Renilla luciferase reporter protein expressed from a constitutive CMV promoter. Twenty-four hours later, the culture medium was replaced with fresh medium containing 0, 10, or 50 U of IFN-α2a/ml, and the cells were cultured for a further 8 h and harvested. Extracts were subjected to the dual luciferase reporter assay. ISRE-luciferase values were normalized against the Renilla luciferase value. The graph shows the average relative ISRE-dependent luciferase values and standard deviation from a total of three experiments.
FIG. 5.
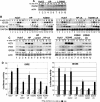
HP mutations specifically confer IFN resistance to HCV RNA replication. (A) Total RNA from cells cultured for 24 h in medium alone or in the presence of increasing concentrations of IFN-α2a was subjected to Northern blot analysis of HCV RNA, ISG6-16, and GAPDH mRNA levels. The lanes show control Huh7 cells cultured in medium alone (0, lane 1) and HCV replicon cells cultured in medium alone (0, 10, or 50 U of IFN-α2a/ml), as indicated above each lane. Lanes 2 to 4 show the original Huh7-HP cells. Lanes 5 to 13 show a cell population (HP pop, lanes 5 to 7) and clonal cell lines (HP cA, lanes 8 to 10; HP cB, lanes 11 to 13) that were derived from naïve Huh7 cells transduced with the reconstructed HP replicon RNA. The original Huh7-K2040 cells (K2040, lanes 14 to 16) and a clonal cell line from naïve Huh7 cells transduced with the reconstructed K2040 replicon RNA (K2040 cA, lanes 17 to 19) were included for comparison. The percentage of HCV RNA remaining in the IFN-treated cells is shown in the bar graph and was derived as described in the legend to Fig. 4. (B) HCV protein, PKR, and actin abundance were evaluated by immunoblot analysis of extracts prepared from cells cultured in medium alone or with increasing amounts of IFN-α2a for 48 h. Shown are Huh7 cells (lanes 1 to 4), Huh7-L2198S cells (lanes 5 to 8), and Huh7-HP cells (lanes 9 to 12). Lanes 13 to 20 show a cell population (HP pop, lanes 13 to 16) and a clonal cell line (HP cA, lanes 17 to 20) that were derived from naïve Huh7 cells transduced by the reconstructed HP replicon RNA. The panels show NS3 and NS5A expression (arrows; top panel), PKR (middle panel), and actin expression (bottom panel). Each lane set represents IFN doses (from left to right) of 0, 10, 100, and 250 U of IFN-α2a/ml.
FIG. 6.
Suppression of ISG56 expression by the HCV HP replicon and restoration of expression in cured cells do not associate with differences in IFN receptor signaling to the ISRE. (A) Immunoblot analysis of ISG56 and actin expression in control Huh7 cells (lanes 1 and 2), Huh7-HP cells (lanes 3 to 6), and Huh7-L2198S cells (lanes 7 to 10). Cells were cultured in medium alone (0) or medium containing 10 U of IFN-α2a/ml for 24, 48, or 72 h as shown above the corresponding lane. (B) Five micrograms of total RNA from cells cultured in medium alone or containing 10 U of IFN-α2a/ml was subjected to Northern blot analysis with cDNA probes specific for ISG56, ISG6-16, or GAPDH. Cells were harvested after 0, 2, 4, 8, 12, or 24 h of IFN treatment, as indicated above each lane. The left panel set shows a comparison of control Huh7 cells (lanes 1 to 6) Huh7-HP cells (lanes 7 to 12), and Huh7-K2040 cells (lanes 13 to 18). The right panel set shows a comparison of control Huh7 cells (lanes 1 to 6) with clonal cell lines derived from naïve Huh7 cells transduced with the reconstructed HP replicon RNA (HP cA; lanes 7 to 12) or the reconstructed K2040 replicon RNA (K2040 cA; lanes 13 to 18) The difference in ISG56 level in replicon cells compared to Huh7 control cells for each time point is shown below the corresponding lane and was quantified as described in the legend to Fig. 4. (C) Immunoblot analysis of NS5A, PKR, ISG56, and actin abundance in cells cultured without IFN (0) or for 6 or 12 h in the presence of 10 U of IFN-α2a/ml, as indicated above each lane. The left panel shows protein expression in control Huh7 cells (lanes 1 to 3), Huh7-HP cells (lanes 4 to 6), Huh7-HP cells devoid of the HCV replicon (HP cured; lanes 7 to 9), and a clonal cell line derived from naïve Huh7 cells transduced with the reconstructed HP replicon RNA (HP cA; lanes 10 to 12). The right panel shows control Huh7 cells (lanes 1 to 3), Huh7-K2040 cells (lanes 4 to 6), Huh7-K2040 cells devoid of the HCV replicon (K2040 cured; lanes 7 to 9), and a clonal cell line derived from naïve Huh7 cells transduced with the reconstructed K2040 replicon RNA (K2040 cA; lanes 7 to 12). To generate cell lines devoid of the HCV replicon, the Huh7-HP and Huh7-K2040 cells were cultured continuously in the presence of high-dose IFN-α2a as described in Materials and Methods. The difference in ISG56 protein level in replicon cells compared to that in Huh7 control cells for each time point is shown below the corresponding lane and was determined by quantitative densitometry of the respective ISG56 and actin bands. (D) IFN signaling to an ISRE-promoter luciferase construct (left) or an ISG56-promoter luciferase construct (right) was measured in control Huh7 cells, Huh7-HP cells (HP), Huh7-HP cells devoid of the HCV replicon (HP cured), Huh7-HP cA cells (HP cA), Huh7-K2040 cells (K2040), Huh7-K2040 cells devoid of the replicon RNA (K2040 cured), or Huh7-K2040 cA cells (K2040 cA). Triplicate cultures of each cell line were cotransfected with a plasmid encoding a Renilla luciferase construct expressed from a constitutive CMV promoter and a second plasmid encoding the IFN-inducible ISRE or ISG56 promoter-enhancer firefly luciferase reporter construct. Cells were cultured in medium containing 0, 10, or 100 U/ml of IFN-α2a for 8 h, harvested, and subjected to the dual luciferase assay. Bars show the average relative firefly luciferase activity and standard deviation of values normalized for Renilla luciferase activity between each sample.
FIG. 7.
Differential ribosome recruitment by the HCV replicon RNA and alteration of the ISG56/(p48)eIF3 ratio associates with IFN-resistant viral RNA replication. Huh7-L2198S cells (left panels) or Huh7-HP cells (right panels) were cultured in medium alone or in medium containing 100 U of IFN-α2a/ml for 16 h. Cell extracts were prepared for polyribosome distribution analysis, and RNA-protein complexes were separated by ultracentrifugation through a sucrose density gradient. Gradient fractions were collected and simultaneously monitored for OD258 values. (A) The relative density of each fraction from the respective gradient is shown in the panel set, and the gradient positions of the template-associated 40S ribosome, 80S ribosome, and polyribosomes are indicated. (B) The gradient distribution of the HCV replicon RNA and β-actin were monitored by RT-PCR analysis of an equal volume of total RNA isolated from each fraction. Panel sets correspond to the gradient OD258 profile shown above each set and were derived from an ethidium bromide-stained agarose gel of the resolved RT-PCR products as indicated. Lane numbers shown beneath each gel image correspond to the fraction numbers shown in the respective OD258 profile. Lanes C1 and C2 on the far left show control RT-PCR products from a reaction mixture containing RNA from sucrose gradient fraction 4 derived from Huh7-HP cells cultured without IFN. (C) Proteins were extracted from sucrose gradient fractions 1 and 2 containing 40S and 80S ribosome-associated RNA from the IFN-treated Huh7-L2198S cells (left) or Huh7-HP cells (right) shown above. The abundance of ISG56 and eIF3 was measured by immunoblot analysis and quantitative densitometry of the products shown to derive the indicated ISG56/(p48)eIF3 ratio. The eIF3 panel shows the (p48)eIF3 subunit, which is an interacting partner with ISG56 (20). Comprehensively similar results were obtained from cells cultured in the presence or absence of 10 U of IFN/ml (data not shown).
Similar articles
- Alpha interferon induces distinct translational control programs to suppress hepatitis C virus RNA replication.
Wang C, Pflugheber J, Sumpter R Jr, Sodora DL, Hui D, Sen GC, Gale M Jr. Wang C, et al. J Virol. 2003 Apr;77(7):3898-912. doi: 10.1128/jvi.77.7.3898-3912.2003. J Virol. 2003. PMID: 12634350 Free PMC article. - Establishment of a subgenomic replicon for bovine viral diarrhea virus in Huh-7 cells and modulation of interferon-regulated factor 3-mediated antiviral response.
Horscroft N, Bellows D, Ansari I, Lai VC, Dempsey S, Liang D, Donis R, Zhong W, Hong Z. Horscroft N, et al. J Virol. 2005 Mar;79(5):2788-96. doi: 10.1128/JVI.79.5.2788-2796.2005. J Virol. 2005. PMID: 15708997 Free PMC article. - Antiviral effect and virus-host interactions in response to alpha interferon, gamma interferon, poly(i)-poly(c), tumor necrosis factor alpha, and ribavirin in hepatitis C virus subgenomic replicons.
Lanford RE, Guerra B, Lee H, Averett DR, Pfeiffer B, Chavez D, Notvall L, Bigger C. Lanford RE, et al. J Virol. 2003 Jan;77(2):1092-104. doi: 10.1128/jvi.77.2.1092-1104.2003. J Virol. 2003. PMID: 12502825 Free PMC article. - Understanding the molecular mechanism(s) of hepatitis C virus (HCV) induced interferon resistance.
Qashqari H, Al-Mars A, Chaudhary A, Abuzenadah A, Damanhouri G, Alqahtani M, Mahmoud M, El Sayed Zaki M, Fatima K, Qadri I. Qashqari H, et al. Infect Genet Evol. 2013 Oct;19:113-9. doi: 10.1016/j.meegid.2013.06.025. Epub 2013 Jul 5. Infect Genet Evol. 2013. PMID: 23831932 Review. - [Interferon resistance and ISDR (interferon sensitivity determining region)].
Amemiya F, Maekawa S, Enomoto N. Amemiya F, et al. Nihon Rinsho. 2006 Jul;64(7):1249-53. Nihon Rinsho. 2006. PMID: 16838640 Review. Japanese.
Cited by
- Epigenetic silencing of antiviral genes renders clones of Huh-7 cells permissive for hepatitis C virus replication.
Chen Q, Denard B, Huang H, Ye J. Chen Q, et al. J Virol. 2013 Jan;87(1):659-65. doi: 10.1128/JVI.01984-12. Epub 2012 Oct 31. J Virol. 2013. PMID: 23115279 Free PMC article. - Nanopore sequencing provides snapshots of the genetic variation within salmonid alphavirus-3 (SAV3) during an ongoing infection in Atlantic salmon (Salmo salar) and brown trout (Salmo trutta).
Roh H, Skaftnesmo KO, Kannimuthu D, Madhun A, Patel S, Kvamme BO, Morton HC, Grove S. Roh H, et al. Vet Res. 2024 Sep 3;55(1):106. doi: 10.1186/s13567-024-01349-z. Vet Res. 2024. PMID: 39227887 Free PMC article. - Viral determinants of resistance to treatment in patients with hepatitis C.
Wohnsland A, Hofmann WP, Sarrazin C. Wohnsland A, et al. Clin Microbiol Rev. 2007 Jan;20(1):23-38. doi: 10.1128/CMR.00010-06. Clin Microbiol Rev. 2007. PMID: 17223621 Free PMC article. Review. - Characterization of hepatitis C virus subgenomic replicon resistance to cyclosporine in vitro.
Robida JM, Nelson HB, Liu Z, Tang H. Robida JM, et al. J Virol. 2007 Jun;81(11):5829-40. doi: 10.1128/JVI.02524-06. Epub 2007 Mar 21. J Virol. 2007. PMID: 17376913 Free PMC article. - Convergent evolution of escape from hepaciviral antagonism in primates.
Patel MR, Loo YM, Horner SM, Gale M Jr, Malik HS. Patel MR, et al. PLoS Biol. 2012;10(3):e1001282. doi: 10.1371/journal.pbio.1001282. Epub 2012 Mar 13. PLoS Biol. 2012. PMID: 22427742 Free PMC article.
References
- Akira, S. 2003. Mammalian Toll-like receptors. Curr. Opin. Immunol. 15:238. [Erratum.] - PubMed
- Barnes, B., B. Lubyova, and P. M. Pitha. 2002. On the role of IRF in host defense. J. Interferon Cytokine Res. 22:59-71. - PubMed
- Blight, K. J., A. A. Kolykhalov, and C. M. Rice. 2000. Efficient inititation of HCV RNA replication in cell culture. Science 290:1972-1974. - PubMed
- Cheney, I. W., S. Naim, V. C. Lai, S. Dempsey, D. Bellows, M. P. Walker, J. H. Shim, N. Horscroft, Z. Hong, and W. Zhong. 2002. Mutations in NS5B polymerase of hepatitis C virus: impacts on in vitro enzymatic activity and viral RNA replication in the subgenomic replicon cell culture. Virology 297:298-306. - PubMed
Publication types
MeSH terms
Substances
Grants and funding
- AI060389/AI/NIAID NIH HHS/United States
- R01 AI060389/AI/NIAID NIH HHS/United States
- T32-GM08203/GM/NIGMS NIH HHS/United States
- AI48235/AI/NIAID NIH HHS/United States
- T32 AI007520/AI/NIAID NIH HHS/United States
- T32 AI 07520/AI/NIAID NIH HHS/United States
- U01 AI048235/AI/NIAID NIH HHS/United States
- R56 AI060389/AI/NIAID NIH HHS/United States
- T32 GM008203/GM/NIGMS NIH HHS/United States
LinkOut - more resources
Full Text Sources
Other Literature Sources
Research Materials
Miscellaneous
