CHOP induces death by promoting protein synthesis and oxidation in the stressed endoplasmic reticulum - PubMed (original) (raw)
Comparative Study
. 2004 Dec 15;18(24):3066-77.
doi: 10.1101/gad.1250704.
Affiliations
- PMID: 15601821
- PMCID: PMC535917
- DOI: 10.1101/gad.1250704
Comparative Study
CHOP induces death by promoting protein synthesis and oxidation in the stressed endoplasmic reticulum
Stefan J Marciniak et al. Genes Dev. 2004.
Abstract
Unfolded and malfolded client proteins impose a stress on the endoplasmic reticulum (ER), which contributes to cell death in pathophysiological conditions. The transcription factor C/EBP homologous protein (CHOP) is activated by ER stress, and CHOP deletion protects against its lethal consequences. We find that CHOP directly activates GADD34, which promotes ER client protein biosynthesis by dephosphorylating phospho-Ser 51 of the alpha-subunit of translation initiation factor 2 (eIF2alpha) in stressed cells. Thus, impaired GADD34 expression reduces client protein load and ER stress in CHOP(-/-) cells exposed to perturbations that impair ER function. CHOP(-/-) and GADD34 mutant cells accumulate less high molecular weight protein complexes in their stressed ER than wild-type cells. Furthermore, mice lacking GADD34-directed eIF2alpha dephosphorylation, like CHOP(-/-) mice, are resistant to renal toxicity of the ER stress-inducing drug tunicamycin. CHOP also activates ERO1alpha, which encodes an ER oxidase. Consequently, the ER of stressed CHOP(-/-) cells is relatively hypo-oxidizing. Pharmacological and genetic manipulations that promote a hypo-oxidizing ER reduce abnormal high molecular weight protein complexes in the stressed ER and protect from the lethal consequences of ER stress. CHOP deletion thus protects cells from ER stress by decreasing ER client protein load and changing redox conditions within the organelle.
Figures
Figure 1.
Transcriptional profiling reveals a slowed induction of the UPR and specific gene defects in CHOP-/- fibroblasts. (A) Graphic representation of the average expression (n = 4) level of 12,488 genes in untreated and tunicamycin-treated, wild-type and CHOP-/- MEFs. Each vertical bar represents a single gene. Green coloration indicates relatively low levels of expression, and red indicates a relatively high level of expression of a given mRNA. (B) Expansion of the cluster of 206 genes significantly activated by tunicamycin in either wild-type or CHOP-/- cells. The genes are arranged (left to right) by descending order of inducibility by tunicamycin in the wild-type sample at the 8-h time point.
Figure 2.
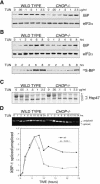
Lower levels of ER stress in tunicamycin-treated CHOP-/- cells. (A) Immunoblots of BiP and eIF2α (a loading control) from wild-type and CHOP-/- cells treated with varying doses of tunicamycin for 6 h. (B) Immunoblots as in A of cells treated with 0.5μg/mL tunicamycin for the indicated period of time (top two panels) and autoradiograph of immunoprecipitated newly synthesized [35S]BiP following pulse labeling of the treated cells (bottom). (C) Autoradiograph of 35S-labeled Hsp47 immunoprecipitated from wild-type and CHOP-/- cells briefly pulsed with [35S]methionine after 1 h of exposure to the indicated concentration of tunicamycin. The position of the glycosylated (G) and nonglycosylated (O) forms of Hsp47 on the SDS-PAGE are indicated. Also indicated is an irrelevant band immunoprecipitated by the anti-Hsp47 antiserum (★) (D) Ethidium bromide-stained gel of unspliced and IRE1-spliced XBP-1 RT-PCR product (reporting on mRNA) following a time course of tunicamycin treatment (0.5 μg/mL). The ratio of spliced/unspliced RNA in each sample in the two genotypes is also presented graphically.
Figure 3.
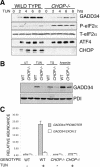
Impaired induction of GADD34 in CHOP-/- cells leads to persistent eIF2α phosphorylation during stress. (A) Immunoblot of GADD34, phosphorylated eIF2α (P-eIF2α), total eIF2α (T-eIF2α) ATF4, and CHOP from lysates of tunicamycin-treated wild-type and CHOP-/- cells. (B) Immunoblot of GADD34 and PDI (a loading control) from lysates of wild-type and CHOP-/- cells, exposed to 2 μg/mL tunicamycin, 400 nM thapsigargin, 25 μM arsenite, or untreated (UT). (C) Chromatin immunoprecipitation of GADD34 with anti-CHOP antiserum from untreated and tunicamycin-treated (2 μg/mL, 8 h) wild-type and CHOP-/- cells detected by a quantitative genomic PCR targeting the promoter region or exon 2 of GADD34. The signal in the untreated CHOP-/- cells was arbitrarily assigned a value of 1.
Figure 4.
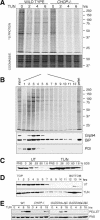
Enhanced recovery of client protein synthesis predis-poses wild-type cells to accumulation of a high-molecular-weight ER protein complex during ER stress. (A) Autoradiograph and Coomassie stain of gel of radiolabeled microsomal proteins isolated by flotation through sucrose from [35S]methionine pulse-labeled wild-type and CHOP-/- MEFs treated with 400 nM thapsigargin. (B) Autoradiograph (top) and Grp94, BiP, and PDI immunoblots (bottom) of proteins from the wild-type 6-h time point of A following velocity gradient centrifugation through a 10%-40% glycerol gradient. (C) BiP immunoblot from untreated and tunicamycin-treated (2μg/mL, 8 h) wild-type cells. A total of 5% of the input, post-nuclear supernatant (PNS), or the pellet obtained from that post-nuclear supernatant treated with the indicated concentration of SDS and subjected to glycerol gradient centrifugation were loaded in each lane. (D) Immunoblot of BiP from fractions taken through the glycerol gradient from a 0.8% SDS-treated sample as in C (note that BiP migrating through the cushion as a large complex forms a distinct peak that is separated by a clear zone from the low-molecular-weight material). (E) Immunoblot of pelleted BiP (as in D) and 5% of the input post-nuclear supernatant (PNS) BiP from untreated and tunicamycin treated wild-type, CHOP-/- and GADD34 mutant cells.
Figure 6.
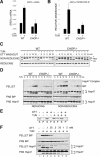
CHOP-dependent ERO1α induction favors abnormal oxidized protein complexes. (A) Abundance of ERO1α mRNA in untreated and tunicamycin-treated (2 μg/mL, 8 h) wild-type and CHOP-/- cells measured by quantitative real-time PCR and expressed as the ratio of ERO1α mRNA to β Actin mRNA. (B) Chromatin immunoprecipitation of _ERO1_α with anti-CHOP antiserum from untreated and tunicamycin-treated wild-type and CHOP-/- cells detected by a quantitative genomic PCR targeting the promoter region of _ERO1_α. The signal in the untreated CHOP-/- cells was arbitrarily assigned a value of 1. (C) Immunoblot of PDI from untreated and tunicamycin-treated wild-type and CHOP-/- cells challenged in vivo with DTT and then chased in the absence of reducing agent for the indicated period of time before lysis in a nonreducing buffer. Identical samples were loaded on a reducing and nonreducing gel. The position of the low-mobility reduced form (RED) and higher-mobility oxidized form (OX) of PDI is indicated next to the nonreducing SDS-PAGE. An uncharacterized invariant band reactive with the PDI antibody is indicated by the asterisk. (D) Immunoblot of Hsp47 and BiP in SDS-resistant HMW complexes (PELLET) and 5% input post-nuclear supernatant (PNS) from wild-type and CHOP-/- cells treated with tunicamycin (2 μg/mL) for the indicated time. Identical samples were loaded on a reducing (left) and nonreducing (right) SDS-PAGE. The position of the Hsp47 disulfide-stabilized complex, glycosylated (G) and nonglycosylated (O) monomer and BiP are indicated. (E) Immunoblot of BiP in HMW complex pellet (P) and supernatant (S) from untreated and tunicamycin-treated (2 μg/mL, 8 h) wild-type cells isolated by velocity centrifugation through 20% glycerol cushions containing 100 mM DTT. (F) Immunoblot of BiP and Hsp 47 in SDS-resistant HMW complex (PELLET) and 5% input post-nuclear supernatant (PNS) from wild-type cells treated with tunicamycin (2 μg/mL) and the indicated concentrations of DTT in vivo for 8 h.
Figure 5.
Loss of GADD34 phosphatase activity protects the renal epithelium from tunicamycin. (A) Photomicrograhs (10×) of wild-type, _GADD34_Δ_C/Δ_C and CHOP-/- mouse kidneys stained with hematoxylin and eosin 96 h after injection with 1 μg/gram of tunicamycin. (B) Photomicrographs (100× and 400×) from the same sections. Note the extensive tubular-interstitial damage at the cortico-meduallary junction in the representative wild-type sample and its absence in the mutants. (C) Quantification of tubularinterstitial damage at 96 h in tunicamycin-treated wild-type (n = 12 animals), _GADD34_Δ_C/Δ_C (n = 12), CHOP+/- (n = 8), and CHOP-/- (n = 8). Grading by modified Shih scale (Shih et al. 1988) and P values calculated by a Mann-Whitney nonparametric test. (D) Quantification of cell death by counting TUNEL-positive cells per high-powered field (hpf) in kidneys from 12 wild-type and 12 _GADD34_Δ_C/Δ_C animals. The means of two fields per kidney of each animal are presented. The mean ± SEM of each genotype is indicated by a horizontal bar and P values were calculated by 2-tail Student's _t_-test. (E) Photomicrograph (400×) of cortico-medullary junction of wild-type and _GADD34_Δ_C/Δ_C kidneys stained for TUNEL and counter-stained with Hoescht.
Figure 7.
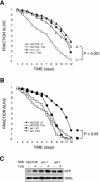
Knock-down of ero-1 in C. elegans is protective against the lethal effects of tunicamycin. Survival curves of young adult nematodes raised on mock RNAi, ero-1 RNAi, and sel-1 RNAi, and treated at day 0 with 30 μg/mL of tunicamycin for 24 h.(A) Comparison of the mock RNAi and the ero-1 RNAi. Shown is a representative experiment (n = 3). (B) Comparison of mock RNAi and sel-1 RNAi. The data in A and B are from the same experiment and are represented in two graphs for clarity. P values for the divergence of the curves were determined using two-factor ANOVA analysis. (C) Immunoblot of lysates from hsp-4::gfp animals after growth on the indicated RNAi and treatment for 24 h with 30 μg/mL of tunicamycin. The GFP signal reflects activity of the UPR reporter, while the anti-HDEL antibody detects an invariant 50-kDa band used here as a loading control.
Similar articles
- The function of GADD34 is a recovery from a shutoff of protein synthesis induced by ER stress: elucidation by GADD34-deficient mice.
Kojima E, Takeuchi A, Haneda M, Yagi A, Hasegawa T, Yamaki K, Takeda K, Akira S, Shimokata K, Isobe K. Kojima E, et al. FASEB J. 2003 Aug;17(11):1573-5. doi: 10.1096/fj.02-1184fje. Epub 2003 Jun 3. FASEB J. 2003. PMID: 12824288 - Control of PERK eIF2alpha kinase activity by the endoplasmic reticulum stress-induced molecular chaperone P58IPK.
Yan W, Frank CL, Korth MJ, Sopher BL, Novoa I, Ron D, Katze MG. Yan W, et al. Proc Natl Acad Sci U S A. 2002 Dec 10;99(25):15920-5. doi: 10.1073/pnas.252341799. Epub 2002 Nov 22. Proc Natl Acad Sci U S A. 2002. PMID: 12446838 Free PMC article. - Sodium 4-phenylbutyrate protects against liver ischemia reperfusion injury by inhibition of endoplasmic reticulum-stress mediated apoptosis.
Vilatoba M, Eckstein C, Bilbao G, Smyth CA, Jenkins S, Thompson JA, Eckhoff DE, Contreras JL. Vilatoba M, et al. Surgery. 2005 Aug;138(2):342-51. doi: 10.1016/j.surg.2005.04.019. Surgery. 2005. PMID: 16153446 - Roles of CHOP/GADD153 in endoplasmic reticulum stress.
Oyadomari S, Mori M. Oyadomari S, et al. Cell Death Differ. 2004 Apr;11(4):381-9. doi: 10.1038/sj.cdd.4401373. Cell Death Differ. 2004. PMID: 14685163 Review. - Shut-down of translation, a global neuronal stress response: mechanisms and pathological relevance.
Paschen W, Proud CG, Mies G. Paschen W, et al. Curr Pharm Des. 2007;13(18):1887-902. doi: 10.2174/138161207780858401. Curr Pharm Des. 2007. PMID: 17584115 Review.
Cited by
- VCP inhibitors induce endoplasmic reticulum stress, cause cell cycle arrest, trigger caspase-mediated cell death and synergistically kill ovarian cancer cells in combination with Salubrinal.
Bastola P, Neums L, Schoenen FJ, Chien J. Bastola P, et al. Mol Oncol. 2016 Dec;10(10):1559-1574. doi: 10.1016/j.molonc.2016.09.005. Epub 2016 Sep 28. Mol Oncol. 2016. PMID: 27729194 Free PMC article. - Endoplasmic reticulum polymers impair luminal protein mobility and sensitize to cellular stress in alpha1-antitrypsin deficiency.
Ordóñez A, Snapp EL, Tan L, Miranda E, Marciniak SJ, Lomas DA. Ordóñez A, et al. Hepatology. 2013 May;57(5):2049-60. doi: 10.1002/hep.26173. Epub 2013 Mar 14. Hepatology. 2013. PMID: 23197448 Free PMC article. - Cell intrinsic and extrinsic activators of the unfolded protein response in cancer: Mechanisms and targets for therapy.
Tameire F, Verginadis II, Koumenis C. Tameire F, et al. Semin Cancer Biol. 2015 Aug;33:3-15. doi: 10.1016/j.semcancer.2015.04.002. Epub 2015 Apr 25. Semin Cancer Biol. 2015. PMID: 25920797 Free PMC article. Review. - The role of the unfolded protein response in diabetes mellitus.
Iwawaki T, Oikawa D. Iwawaki T, et al. Semin Immunopathol. 2013 May;35(3):333-50. doi: 10.1007/s00281-013-0369-5. Epub 2013 Mar 26. Semin Immunopathol. 2013. PMID: 23529219 Review. - Mifepristone increases mRNA translation rate, triggers the unfolded protein response, increases autophagic flux, and kills ovarian cancer cells in combination with proteasome or lysosome inhibitors.
Zhang L, Hapon MB, Goyeneche AA, Srinivasan R, Gamarra-Luques CD, Callegari EA, Drappeau DD, Terpstra EJ, Pan B, Knapp JR, Chien J, Wang X, Eyster KM, Telleria CM. Zhang L, et al. Mol Oncol. 2016 Aug;10(7):1099-117. doi: 10.1016/j.molonc.2016.05.001. Epub 2016 May 17. Mol Oncol. 2016. PMID: 27233943 Free PMC article.
References
- Bertolotti A., Zhang, Y., Hendershot, L., Harding, H., and Ron, D. 2000. Dynamic interaction of BiP and the ER stress transducers in the unfolded protein response. Nat. Cell. Biol. 2: 326-332. - PubMed
- Brush M.H., Weiser, D.C., and Shenolikar, S. 2003. Growth arrest and DNA damage-inducible protein GADD34 targets protein phosphatase 1α to the endoplasmic reticulum and promotes dephosphorylation of the α subunit of eukaryotic translation initiation factor 2. Mol. Cell. Biol. 23: 1292-1303. - PMC - PubMed
- Calfon M., Zeng, H., Urano, F., Till, J.H., Hubbard, S.R., Harding, H.P., Clark, S.G., and Ron, D. 2002. IRE1 couples endoplasmic reticulum load to secretory capacity by processing the XBP-1 mRNA. Nature 415: 92-96. - PubMed
- Fagioli C., Mezghrani, A., and Sitia, R. 2001. Reduction of interchain disulfide bonds precedes the dislocation of Ig-μ chains from the endoplasmic reticulum to the cytosol for proteasomal degradation. J. Biol. Chem. 276: 40962-40967. - PubMed
Publication types
MeSH terms
Substances
Grants and funding
- R01 DK047119/DK/NIDDK NIH HHS/United States
- R01 ES008681/ES/NIEHS NIH HHS/United States
- ES08681/ES/NIEHS NIH HHS/United States
- R37 DK047119/DK/NIDDK NIH HHS/United States
- DK47119/DK/NIDDK NIH HHS/United States
LinkOut - more resources
Full Text Sources
Other Literature Sources
Molecular Biology Databases
Research Materials

