Transdifferentiation of mature rat hepatocytes into bile duct-like cells in vitro - PubMed (original) (raw)
Transdifferentiation of mature rat hepatocytes into bile duct-like cells in vitro
Yuji Nishikawa et al. Am J Pathol. 2005 Apr.
Abstract
We investigated the mechanism of phenotypic plasticity of hepatocytes in a three-dimensional organoid culture system, in which hepatocytic spheroids were embedded within a collagen gel matrix. Hepatocytes expressed several bile duct markers including cytokeratin (CK) 19 soon after culture and underwent branching morphogenesis within the matrix in the presence of insulin and epidermal growth factor. Cultured hepatocytes did not express Delta-like, a specific marker for oval cells and hepatoblasts. Furthermore, hepatocytes isolated from c-kit mutant rats (Ws/Ws), which are defective in proliferation of oval cells, showed essentially the same phenotypic changes as those isolated from control rats. The bile duct-like differentiation of hepatocytes was associated with increased expression of Jagged1, Jagged2, Notch1, and several Notch target genes. CK19 expression and branching morphogenesis were inhibited by dexamethasone, a mitogen-activated protein kinase kinase 1 (MEK1) inhibitor (PD98059), and a phosphatidyl inositol 3-kinase inhibitor (LY294002). After being cultured for more than 3 weeks within the gels, hepatocytes transformed into ductular structures surrounded by basement membranes. Our results suggest that hepatocytes might have the potential to transdifferentiate into bile duct-like cells without acquiring a stem-like phenotype and that this is mediated through specific protein tyrosine phosphorylation pathways.
Figures
Figure 1
Branching morphogenesis and bile duct-specific CK expression in the three-dimensional cultures of hepatocytes within a collagen gel matrix. A: Spheroidal aggregates of isolated hepatocytes on positively charged plastic dishes (3 days after culture). Phase-contrast microscopy. Original magnification, ×25. B: Spheroidal aggregates cultured for 7 days within the matrix in the absence (left) or presence (right) of insulin (10−7 mol/L) and EGF (10 ng/ml). Phase-contrast microscopy. Original magnification, ×25. C: Western blot analyses for the expression of albumin, HNF-1, HNF-4α, CK8, CK19, CK20, and actin in hepatocytes at various time periods after culture in the presence of insulin (10−7 mol/L) and EGF (10 ng/ml). D: Western blot analyses for the expression of CK8, CK19, CK20, and SE-1 (sinusoidal endothelial cell marker) in freshly isolated hepatocytes, nonparenchymal cells, and portal tissues.
Figure 2
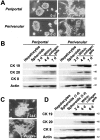
Branching morphogenesis and bile duct-specific CK expression of periportal and perivenular hepatocytes and Ws/Ws rat hepatocytes within a collagen gel matrix. Cells were cultured in the presence of insulin (10−7 mol/L) and EGF (10 ng/ml). A: Branching morphogenesis of periportal and perivenular hepatocytic spheroids. Phase-contrast microscopy. Original magnification, ×25. B: Western blot analyses for the expression of CK19, CK20, CK8, and actin in cultured periportal and perivenular hepatocytes. C: Branching morphogenesis of normal (F344) and c-kit mutant (Ws/Ws) rat hepatocytes. Phase-contrast microscopy. Original magnification, ×25. D: Western blot analyses for the expression of CK19, CK20, CK8, and actin in cultured Ws/Ws hepatocytes.
Figure 3
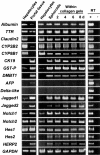
Time course of gene expression of various hepatocyte-, bile duct-, and oval cell-specific markers and the molecules involved in the Notch signaling pathway in cultured hepatocytes. Cells were cultured in the presence of insulin (10−7 mol/L) and EGF (10 ng/ml) and total RNA was extracted. RT-PCR analyses for the expression of albumin, transthyretin (TTR), claudin2, CYP2B2, CYP8B1, CK19, glutathione _S_-transferase placental form (GST-P), DMBT1, AFP, Delta-like, Notch ligands (Jagged1 and Jagged2), Notch receptors (Notch1 and Notch2), and primary Notch targets (Hes1, Hes2, HERP2). Comparison of gene expression between freshly isolated hepatocytes and the portal tissue containing bile ducts is shown at the left. For control, reverse transcriptase was omitted from the reaction mixture for each primer set with hepatocyte RNA (albumin, transthyretin, claudin2, CYP2B2, and CYP8B1), portal tissue RNA (CK19, GST-P, DMBT1, Jagged1, Jagged2, Notch1, Notch2, Hes1, Hes2, HERP2, and GAPDH), or E17.5 fetal liver RNA (AFP and Delta-like) as a template (right). GAPDH expression was assessed for the quality and quantity of each template RNA.
Figure 4
Effects of dexamethasone (Dex) on the morphogenesis of hepatocytic spheroids within a collagen gel matrix and gene expression of several differentiation markers. Hepatocytes were cultured in the presence of insulin (10−7 mol/L) and EGF (10 ng/ml), with or without Dex (10 μmol/L). A: Phase-contrast microscopy of spheroid morphology cultured for 7 days within the gels. Original magnification, ×25. B: RT-PCR analyses for the time course of expression of albumin, CYP2B2, CK19, DMBT1, Jagged1, and Notch1 in hepatocytes cultured on type I collagen-coated plastic dishes. GAPDH expression was assessed for the quality and quantity of each template RNA.
Figure 5
Effects of EGF, insulin, and signal transduction inhibitors on gene expression of bile duct markers in hepatocytes. Hepatocytes were cultured on type I collagen-coated plastic dishes for 4 days. A, B: RT-PCR analyses for the expression of CK19, DMBT1, Jagged1, and Notch1. A: Effects of EGF (10 ng/ml), insulin (10−7 mol/L), or both on the gene expression. B: RT-PCR analyses of the effects of PD98059 (mitogen-activated protein kinase 1 inhibitor) and LY294002 (PI 3-kinase inhibitor) on gene expression in the presence of EGF (10 ng/ml). GAPDH expression was assessed for the quality and quantity of each template RNA.
Figure 6
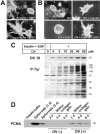
Effects of sodium orthovanadate (OV) on branching morphogenesis and CK19 expression of cultured hepatocytes. Hepatocytic spheroids were cultured within a type I collagen gel matrix for 7 days (A) or 4 days (B) in the presence of insulin (10−7 mol/L), EGF (10 ng/ml), or sodium orthovanadate (OV, 40 μmol/L). A, B: Phase-contrast microscopy. Original magnification, ×25. C: Western blot analyses for CK19- and tyrosine-phosphorylated proteins. D: Western blot analysis for PCNA.
Figure 7
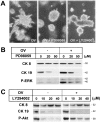
Effects of signal transduction inhibitors on branching morphogenesis and CK expression of cultured hepatocytes. Spheroidal aggregates were cultured within a type I collagen gel matrix for 7 days (A) or 4 days (B, C) in a medium supplemented with insulin (10−7 mol/L) and EGF (10 ng/ml). A: Phase-contrast microscopy showing the effects of PD98059 (50 μmol/L) or LY294002 (40 μmol/L) in the presence of orthovanadate (OV, 40 μmol/L). Original magnification, ×25. B, C: Western blot analyses for the effects of PD98059 (B) or LY294002 (C) on expression of CK8, CK19, phosphorylated ERK (B), and phosphorylated Akt (C).
Figure 8
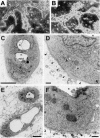
Bile duct-like morphology of hepatocytic aggregates after long-term culture. Spheroidal aggregates were cultured within a collagen gel matrix for 21 days (A), 25 days (C, D), or 90 days (B, E, F) in the presence of insulin (10−7 mol/L) and EGF (10 ng/ml). A, B: Phase-contrast microscopy. Original magnification, ×25. C–F: Electron microscopy. The asterisks denote a lumen of the same ductular structure. Basement membranes are indicated by triangles in D and F. Scale bars: 5 μm (C, E), 0.5 μm (D, F).
Figure 9
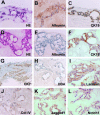
Bile duct-like phenotype of hepatocytic aggregates after long-term culture. Spheroidal aggregates were cultured within a type I collagen gel matrix for 25 days (A–C) or 90 days (D–L) in the presence of insulin (10−7 mol/L) and EGF (10 ng/ml). A, D: H&E staining. B, C, E–G, I–L: Immunocytochemistry for albumin (B, E), CK19 (C, F), cytokeratin 7 (CK7) (G), laminin (I), type IV collagen (Col-IV) (J), Jagged1 (K), and Notch1 (L). H: Lectin cytochemistry for Dolichos biflorus agglutinin (DBA). Original magnifications, ×100.
Similar articles
- Transdifferentiation of mature hepatocytes into bile duct/ductule cells within a collagen gel matrix.
Nishikawa Y. Nishikawa Y. Methods Mol Biol. 2012;826:153-60. doi: 10.1007/978-1-61779-468-1_13. Methods Mol Biol. 2012. PMID: 22167647 - Recovery of mature hepatocytic phenotype following bile ductular transdifferentiation of rat hepatocytes in vitro.
Sone M, Nishikawa Y, Nagahama Y, Kumagai E, Doi Y, Omori Y, Yoshioka T, Tokairin T, Yoshida M, Sugiyama T, Enomoto K. Sone M, et al. Am J Pathol. 2012 Dec;181(6):2094-104. doi: 10.1016/j.ajpath.2012.08.034. Epub 2012 Oct 4. Am J Pathol. 2012. PMID: 23041063 - Tumor necrosis factor-α promotes bile ductular transdifferentiation of mature rat hepatocytes in vitro.
Nishikawa Y, Sone M, Nagahama Y, Kumagai E, Doi Y, Omori Y, Yoshioka T, Tokairin T, Yoshida M, Yamamoto Y, Ito A, Sugiyama T, Enomoto K. Nishikawa Y, et al. J Cell Biochem. 2013 Apr;114(4):831-43. doi: 10.1002/jcb.24424. J Cell Biochem. 2013. PMID: 23097189 - Embryonic liver cells and permanent lines as models for hepatocyte and bile duct cell differentiation.
Strick-Marchand H, Weiss MC. Strick-Marchand H, et al. Mech Dev. 2003 Jan;120(1):89-98. doi: 10.1016/s0925-4773(02)00335-0. Mech Dev. 2003. PMID: 12490299 Review. - [Tissue morphogenesis of liver epithelial cells].
Tanimizu N, Mitaka T. Tanimizu N, et al. Seikagaku. 2012 Aug;84(8):658-65. Seikagaku. 2012. PMID: 23012876 Review. Japanese. No abstract available.
Cited by
- Liver regeneration: alternative epithelial pathways.
Michalopoulos GK. Michalopoulos GK. Int J Biochem Cell Biol. 2011 Feb;43(2):173-9. doi: 10.1016/j.biocel.2009.09.014. Epub 2009 Sep 27. Int J Biochem Cell Biol. 2011. PMID: 19788929 Free PMC article. Review. - Gallbladder epithelial cells that engraft in mouse liver can differentiate into hepatocyte-like cells.
Lee SP, Savard CE, Kuver R. Lee SP, et al. Am J Pathol. 2009 Mar;174(3):842-53. doi: 10.2353/ajpath.2009.080262. Epub 2009 Feb 13. Am J Pathol. 2009. PMID: 19218347 Free PMC article. - Which is better source for functional hepatocytes?
Tanimizu N, Mitaka T. Tanimizu N, et al. Stem Cell Investig. 2017 Feb 16;4:12. doi: 10.21037/sci.2017.02.08. eCollection 2017. Stem Cell Investig. 2017. PMID: 28275642 Free PMC article. No abstract available. - Tumor-associated macrophages in liver cancer: From mechanisms to therapy.
Cheng K, Cai N, Zhu J, Yang X, Liang H, Zhang W. Cheng K, et al. Cancer Commun (Lond). 2022 Nov;42(11):1112-1140. doi: 10.1002/cac2.12345. Epub 2022 Sep 7. Cancer Commun (Lond). 2022. PMID: 36069342 Free PMC article. Review. - Thy1-positive cells have bipotential ability to differentiate into hepatocytes and biliary epithelial cells in galactosamine-induced rat liver regeneration.
Kon J, Ichinohe N, Ooe H, Chen Q, Sasaki K, Mitaka T. Kon J, et al. Am J Pathol. 2009 Dec;175(6):2362-71. doi: 10.2353/ajpath.2009.080338. Epub 2009 Nov 5. Am J Pathol. 2009. PMID: 19893024 Free PMC article.
References
- Desmet V, Roskams T, Van Eyken P. Ductular reaction in the liver. Pathol Res Pract. 1995;191:513–524. - PubMed
- Popper H. The relation of mesenchymal cell products to hepatic epithelial system. Popper H, Schaffner F, editors. Philadelphia: W. B. Saunders,; Progress in Liver Diseases. 1990:pp 27–38. - PubMed
- Haque S, Haruna Y, Saito K, Nalesnik MA, Atillasoy E, Thung SN, Gerber MA. Identification of bipotential progenitor cells in human liver regeneration. Lab Invest. 1996;75:699–705. - PubMed
- Theise ND, Saxena R, Portmann BC, Thung SN, Yee H, Chiriboga L, Kumar A, Crawford JM. The canals of Hering and hepatic stem cells in humans. Hepatology. 1999;30:1425–1433. - PubMed
- Alison M. Liver stem cells: a two compartment system. Curr Opin Cell Biol. 1998;10:710–715. - PubMed
Publication types
MeSH terms
Substances
LinkOut - more resources
Full Text Sources
Research Materials
Miscellaneous

