17beta-estradiol inhibits inflammatory gene expression by controlling NF-kappaB intracellular localization - PubMed (original) (raw)
17beta-estradiol inhibits inflammatory gene expression by controlling NF-kappaB intracellular localization
Serena Ghisletti et al. Mol Cell Biol. 2005 Apr.
Abstract
Estrogen is an immunoregulatory agent, in that hormone deprivation increases while 17beta-estradiol (E2) administration blocks the inflammatory response; however, the underlying mechanism is still unknown. The transcription factor p65/relA, a member of the nuclear factor kappaB (NF-kappaB) family, plays a major role in inflammation and drives the expression of proinflammatory mediators. Here we report a novel mechanism of action of E2 in inflammation. We observe that in macrophages E2 blocks lipopolysaccharide-induced DNA binding and transcriptional activity of p65 by preventing its nuclear translocation. This effect is selectively activated in macrophages to prevent p65 activation by inflammatory agents and extends to other members of the NF-kappaB family, including c-Rel and p50. We observe that E2 activates a rapid and persistent response that involves the activation of phosphatidylinositol 3-kinase, without requiring de novo protein synthesis or modifying Ikappa-Balpha degradation and mitogen-activated protein kinase activation. Using a time course experiment and the microtubule-disrupting agent nocodazole, we observe that the hormone inhibits p65 intracellular transport to the nucleus. This activity is selectively mediated by estrogen receptor alpha (ERalpha) and not ERbeta and is not shared by conventional anti-inflammatory drugs. These results unravel a novel and unique mechanism for E2 anti-inflammatory activity, which may be useful for identifying more selective ligands for the prevention of the inflammatory response.
Figures
FIG. 1.
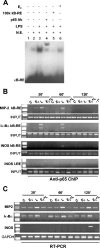
p65 DNA binding activity induced by LPS is inhibited by E2. (A) In vitro DNA binding activity of NF-κB. An EMSA was performed with radiolabeled κB-RE incubated with nuclear extracts (N.E.) from RAW 264.7 cells treated with 1 nM E2 for 10 min followed by the addition of LPS for an additional 30 min. For supershift and competition assays, p65 antibody (Ab) (lane 4) and a 100-fold excess ofunlabeled κB-RE (lane 5) were used, respectively. (B) In vivo DNA binding activity of p65. A chromatin immunoprecipitation (ChIP) assay of RAW 264.7 cells was performed in the absence (C) or presence (E2) of 1 nM E2 for 10 min and then with LPS (L and E2+L) at 50 μg/ml for 30, 60, or 120 min. Immunoprecipitated DNA was analyzed by PCR to amplify MIP-2, Iκ-Bα, and iNOS promoters at κB-RE. PCRs performed with genomic DNA before immunoprecipitation (INPUT) or DNA immunoprecipitated with nonspecific IgG (−I°) or with primers that amplify iNOS promoter DNA that does not contain κB-RE (I-RE) are shown. (C) RT-PCR analysis of MIP-2, Iκ-Bα, and iNOS mRNA levels in cells treated as described for panel B. Each experiment was repeated at least three times.
FIG. 2.
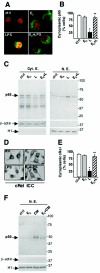
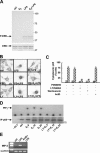
Cytoplasmic localization of NF-κB induced by E2. (A) Confocal microscopy images of fluorescence immunocytochemical analysis of p65 (green) in RAW 264.7 cells treated with 1 nM E2 for 10 min and with LPS for 30 min. Nuclei were counterstained with Sytox orange (red). ctrl, control. (B) Quantification of the effect of E2 on p65 intracellular localization. The percentage of cells with a cytoplasmic localization of p65 is plotted relative to the total cell number. L, LPS. (C) Western blot analysis of p65, β-actin, and histone H1 in cytoplasmic extracts (Cyt. E.) and nuclear extracts (N. E.) from cells treated as described for panel A. (D) c-Rel subcellular localization. The subcel-lular localization of c-Rel in RAW 264.7 cells treated with 1 nM E2 for 10 min and with LPS at 50 μg/ml for 30 min was assessed by immunocytochemical (ICC) analysis with anti-c-Rel antibody. (E) Quantification of the effect of E2 on c-Rel intracellular localization. The percentage of cells with a cytoplasmic localization of c-Rel is plotted relative to the total cell number. (F) Western blot analysis of p50 in nuclear extracts (N. E.) from RAW 264.7 cells treated with a cytokine mixture (CM) for 30 min and with E2 added before the CM. In panels B and E, values are the means ± SDs of a single experiment performed in triplicate. Single and double asterisks indicate P values of <0.05 in a comparison with the control and in a comparison with LPS, respectively.
FIG. 3.
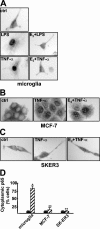
E2 inhibits NF-κB activation selectively in macrophages. (A) p65 subcellular localization in microglia. The localization of p65 in microglia treated with 1 nM E2 for 10 min and with LPS (50 μg/ml) or TNF-α (10 ng/ml) for 30 min was assessed by immunocytochemical analysis with anti-p65 antibody. ctrl, control. (B and C) p65 subcellular localization in MCF-7 and SK-ER3 cells. The localization of p65 in cells treated with 1 nM E2 for 10 min and with TNF-α (10 ng/ml) for 30 min was assessed by immunocytochemical analysis with anti-p65 antibody. (D) Quantification of the effect of E2 on p65 intracellular localization in the cell types shown in panels A, B, and C. The percentage of cells with a cytoplasmic localization of p65 is plotted relative to the total cell number. Black bars, TNF-α; hatched bars, E2 plus TNF-α. Values are the means ± SDs of a single experiment performed in triplicate. Single and double asterisks indicate P values of <0.05 in a comparison with LPS and in a comparison with E2, respectively.
FIG. 4.
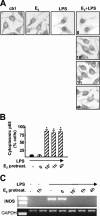
Effect of E2 on NF-κB intracellular localization and inflammatory gene transcription. (A) The subcellular localization of p65 in RAW 264.7 cells treated with E2 and with LPS for 30 min was assessed by immunocytochemical analysis with anti-p65 antibody. ctrl, control. (B) Quantification of the E2 activity shown in panel A. The percentage of cells with cytoplasmic p65 is plotted relative to the total cell number. pretreat., pretreatment. Black bars, LPS; hatched bars, E2 plus LPS. Values are the means ± SDs of a single experiment performed in triplicate. An asterisk indicates a P value of <0.05 in a comparison with LPS. (C) RT-PCR analysis of iNOS mRNA levels in RAW 264.7 cells. E2 was added for the indicated times followed by 3 h of treatment with LPS.
FIG. 5.
The IKK-Iκ-Bα pathway is not modified by E2. (A) Western blot analysis of Iκ-Bα and β-actin proteins in cytoplasmic extracts from RAW 264.7 cells treated with 1 nM E2 for 10 min before treatment with LPS (L) at 50 μg/ml for 5, 10, or 20 min. ctrl, control. (B) Amount of Iκ-Bα calculated as the ratio of the optical density of the Iκ-B band to the optical density of the β-actin band from the Western blot shown in panel A. Symbols: ▪, E2; ▴, LPS; •, E2 plus LPS. Data are from a single representative experiment repeated two times. Norm., normalized. (C) Western blot analysis of phosphorylated IKKα/β (P-IKKα/β) and IKKα/β in total extracts from RAW 264.7 cells treated with 1 nM E2 for 10 min before treatment with LPS at 50 μg/ml for 30 min. (D) Amount of P-IKKα/β calculated as the ratio of the optical density of the P-IKKα/β band to the optical density of the IKKα/β band in three different experiments. White bar, control; gray bar, E2; black bar, LPS; hatched bar, E2 plus LPS. Values are the means ± SDs of three different experiments. An asterisk in panels B and D indicates a P value of <0.05 in a comparison with the control.
FIG. 6.
A nongenomic, PI3K-dependent pathway is necessary for the action of E2. (A) Western blot analysis of phosphorylated ERK (P-ERK) and ERK proteins in total extracts from RAW 264.7 cells treated with 1 nM E2 for 10 min before treatment with LPS at 50 μg/ml for 30 min. ctrl, control. (B) Subcellular localization of p65. Immunocytochemical analysis with anti-p65 antibody was performed on RAW 264.7 cells treated with PD98059 (50 μM) (PD) or LY294002 (50 μM) (LY) for 1 h, with 1 nM E2 for 10 min, and with LPS at 50 μg/ml for 30 min as indicated. (C) Quantification of E2 activity shown in panel B. The percentage of cells with cytoplasmic p65 is plotted relative to the total cell number. Black bars, LPS; hatched bars, E2 plus LPS. Actinomycin D (5 μg/ml) (ActD) was added 1 h before E2 and LPS. Values are the means ± SDs of a single experiment performed in triplicate. Single and double asterisks indicate P values of <0.05 in a comparison with LPS and in a comparison with E2 plus LPS, respectively. (D) PI3K activity. RAW 264.7 cells were treated in the presence or absence of 50 μM LY294002 for 1 h and then with 1 nM E2 for 5, 10, or 20 min. Cell lysates were immunoprecipitated with anti-p85 antibody (lower panel), and PI3K activity was assayed. The upper panel shows a representative autoradiogram of a thin-layer chromatography analysis of the migration of labeled PIP3. (E) Gene transcription inhibition by actinomycin D. MIP-2 mRNA levels in RAW 264.7 cells treated with actinomycin D (5 μg/ml) for 1 h and then with LPS for 1 h were assessed by RT-PCR.
FIG. 7.
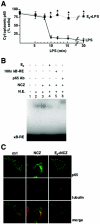
Control of p65 intracellular transport by E2. (A) Time-dependent effect of E2 on p65 localization. RAW 264.7 cells were treated with E2 for 10 min and then with LPS for the indicated times. The subcellular distribution of p65 was assessed by immunocytochemical analysis with anti-p65 antibody and by counting of cells with cytoplasmic p65. The percentage of cells with cytoplasmic p65 is plotted relative to the total cell number. Values are the means ± SDs of three independent experiments. An asterisk indicates a P value of <0.05 in a comparison with LPS. (B) In vitro DNA binding assay of NF-kB. An EMSA for radioactively labeled κB-RE was performed with nuclear extracts (N.E.) from RAW 264.7 cells treated with 1 nM E2 for 10 min followed by the addition of 5 μM NCZ for an additional 45 min. For supershift and competition assays, a 100-fold excess of unlabeled κB-RE (lane 5) and p65 antibody (Ab) (lane 6) were used, respectively. (C) Confocal microscopy images of fluorescence immunocytochemical analysis of p65 and α-tubulin in RAW 264.7 cells treated with 1 nM E2 for 10 min and with 5 μM NCZ for 30 min. ctrl, control.
FIG. 8.
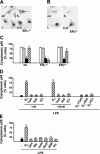
ERα-dependent E2-specific signaling on NF-κB activation. (A and B) Immunocytochemical analysis with anti-p65 antibody of p65 in primary cultures of microglia extracted from ERα-null (ERα−/−) (A) and ERβ-null (ERβ−/−) mice (B) treated with E2 for 10 min and then with LPS (L) for 30 min. ctrl, control. (C) Quantification of the effect of E2 on the subcellular distribution of p65 in primary cultures of microglia from wild-type (wt), ERα−/−, and ERβ−/− mice shown in panels A and B. The percentage of cells with cytoplasmic p65 is plotted relative to the total cell number. Open bars, untreated cells; gray bars, E2; black bars, LPS; hatched bars, E2 plus LPS. (D) Effect of SERM on the subcellular localization of p65. Immunocytochemical analysis with anti-p65 antibody was performed in RAW 264.7 cells treated for 30 min with LPS alone (black bar) or with a prior 10-min exposure to 1 or 100 nM E2, tamoxifen (Tam), raloxifene (Ral), or ICI 182,780 (ICI) (hatched bars). Competition experiments with ER ligands were also performed by adding 100 nM Tam, Ral, or ICI for 10 min before E2 (gray bars). The percentage of cells with cytoplasmic p65 is plotted relative to the total cell number. (E) Effect of anti-inflammatory drugs. Shown is a quantitative assessment of the cytoplasmic localization of p65 in RAW 264.7 cells treated for 30 min with LPS in the absence (black bar) or presence of 1 nM E2, 1 nM dexamethasone (Dex), 100 μM WY14,643 (Wy), 100 μM indomethacin (Indo), 50 μM ibuprophen (Ibup), 5 μM acetylsalicylic acid (ASA), or 50 μM piroxicam (Pir) (hatched bars); drugs were added for 10 min before a 30-min treatment with LPS. Values are the means ± SDs of three independent experiments. Single and double asterisks indicate P values of <0.05 in a comparison with the control and in a comparison with LPS, respectively.
FIG. 9.
Effect of E2 on NF-κB activation. E2 inhibits the effect of LPS on early inflammatory genes by preventing the intracellular transport of NF-κB without altering the Iκ-B degradation pathway. This mechanism is mediated by the ERα isoform and involves PI3K activation.
Similar articles
- Isobutyrylshikonin inhibits lipopolysaccharide-induced nitric oxide and prostaglandin E2 production in BV2 microglial cells by suppressing the PI3K/Akt-mediated nuclear transcription factor-κB pathway.
Jayasooriya RG, Lee KT, Kang CH, Dilshara MG, Lee HJ, Choi YH, Choi IW, Kim GY. Jayasooriya RG, et al. Nutr Res. 2014 Dec;34(12):1111-9. doi: 10.1016/j.nutres.2014.10.002. Epub 2014 Oct 7. Nutr Res. 2014. PMID: 25454762 - Estrogen effects in the myocardium: inhibition of NF-kappaB DNA binding by estrogen receptor-alpha and -beta.
Pelzer T, Neumann M, de Jager T, Jazbutyte V, Neyses L. Pelzer T, et al. Biochem Biophys Res Commun. 2001 Sep 7;286(5):1153-7. doi: 10.1006/bbrc.2001.5519. Biochem Biophys Res Commun. 2001. PMID: 11527420 - Phosphorylation meets ubiquitination: the control of NF-[kappa]B activity.
Karin M, Ben-Neriah Y. Karin M, et al. Annu Rev Immunol. 2000;18:621-63. doi: 10.1146/annurev.immunol.18.1.621. Annu Rev Immunol. 2000. PMID: 10837071 Review. - The Interaction Between NF-κB and Estrogen in Alzheimer's Disease.
Mishra P, Davies DA, Albensi BC. Mishra P, et al. Mol Neurobiol. 2023 Mar;60(3):1515-1526. doi: 10.1007/s12035-022-03152-3. Epub 2022 Dec 13. Mol Neurobiol. 2023. PMID: 36512265 Review.
Cited by
- 17β-estradiol inhibits Notch1 activation in murine macrophage cell line RAW 264.7.
Severi P, Ascierto A, Marracino L, Ouambo Talla AW, Aquila G, Martino V, Dalessandro F, Scarpante I, Minghini G, Haffreingue L, Vieceli Dalla Sega F, Fortini F, Rizzo P. Severi P, et al. Mol Biol Rep. 2024 Nov 8;51(1):1134. doi: 10.1007/s11033-024-10058-x. Mol Biol Rep. 2024. PMID: 39514048 - Menstruation-Related Angina-The Wee Hours.
Goyette S, Mishra T, Raza F, Naqvi Z, Khan S, Khan A, Igman P, Bhat MS. Goyette S, et al. Int J Angiol. 2024 Mar 15;33(4):229-236. doi: 10.1055/s-0044-1782602. eCollection 2024 Dec. Int J Angiol. 2024. PMID: 39502351 Review. - Salivary Transmembrane Mucins of the MUC1 Family (CA 15-3, CA 27.29, MCA) in Breast Cancer: The Effect of Human Epidermal Growth Factor Receptor 2 (HER2).
Dyachenko EI, Bel'skaya LV. Dyachenko EI, et al. Cancers (Basel). 2024 Oct 12;16(20):3461. doi: 10.3390/cancers16203461. Cancers (Basel). 2024. PMID: 39456554 Free PMC article. - Ovariectomy and Estradiol Supplementation Prevents Cyclophosphamide- and Doxorubicin-Induced Spatial Memory Impairment in Tumor-Bearing MMTV-PyVT Mice.
Botelho R, Philpot RM. Botelho R, et al. eNeuro. 2024 Sep 20;11(9):ENEURO.0206-24.2024. doi: 10.1523/ENEURO.0206-24.2024. Print 2024 Sep. eNeuro. 2024. PMID: 39187375 Free PMC article. - Immune Cells, Gut Microbiota, and Vaccines: A Gender Perspective.
Rio P, Caldarelli M, Chiantore M, Ocarino F, Candelli M, Gasbarrini A, Gambassi G, Cianci R. Rio P, et al. Cells. 2024 Mar 17;13(6):526. doi: 10.3390/cells13060526. Cells. 2024. PMID: 38534370 Free PMC article. Review.
References
- Auphan, N., J. DiDonato, C. Rosette, A. Hemberg, and M. Karin. 1995. Immunosuppression by glucocorticoids: inhibition of NFκB activity through induction of IκB synthesis. Science 270:286-290. - PubMed
- Bebo, B. F., Jr., A. Fyfe-Johnson, K. Adlard, A. G. Beam, A. A. Vandenbark, and H. Offner. 2001. Low-dose estrogen therapy ameliorates experimental autoimmune encephalomyelitis in two different inbred mouse strains. J. Immunol. 166:2080-2089. - PubMed
- Beg, A. A., W. C. Sha, R. T. Bronson, and D. Baltimore. 1995. Constitutive NF-kappa B activation, enhanced granulopoiesis, and neonatal lethality in I kappa B alpha-deficient mice. Genes Dev. 9:2736-2746. - PubMed
- Bourgarel-Rey, V., S. Vallee, O. Rimet, S. Champion, D. Braguer, A. Desobry, C. Briand, and Y. Barra. 2001. Involvement of nuclear factor kappaB in c-Myc induction by tubulin polymerization inhibitors. Mol. Pharmacol. 59:1165-1170. - PubMed
Publication types
MeSH terms
Substances
LinkOut - more resources
Full Text Sources
Molecular Biology Databases
Research Materials
