Molecular dynamics and protein function - PubMed (original) (raw)
Molecular dynamics and protein function
M Karplus et al. Proc Natl Acad Sci U S A. 2005.
Abstract
A fundamental appreciation for how biological macromolecules work requires knowledge of structure and dynamics. Molecular dynamics simulations provide powerful tools for the exploration of the conformational energy landscape accessible to these molecules, and the rapid increase in computational power coupled with improvements in methodology makes this an exciting time for the application of simulation to structural biology. In this Perspective we survey two areas, protein folding and enzymatic catalysis, in which simulations have contributed to a general understanding of mechanism. We also describe results for the F(1) ATPase molecular motor and the Src family of signaling proteins as examples of applications of simulations to specific biological systems.
Figures
Fig. 1.
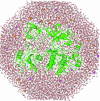
Simulation of a solvated protein. This slice through a simulation system shows a Src kinase protein (green) surrounded by ≈15,000 water molecules (oxygen atoms are red and hydrogen atoms are white). The simulation system consists of ≈50,000 atoms, including potassium and chloride ions (purple and orange spheres, respectively). A 1-ns molecular dynamics trajectory for this system can be generated in 4 days by using a cluster of four inexpensive Linux-based computers. (Courtesy of Olga Kuchment.)
Fig. 2.
Simulations of the folding of a three-helix bundle protein. (a and b)(Upper) Semilog plots of the time dependence of the fractions of native helical and interhelical contacts and the inverse fractions of native volume (calculated from the inverse cube of the radius of gyration) for two different trajectories. (Lower) Structures of the protein molecule at selected times. [Reproduced with permission from ref. (Copyright 1999, Nature Publishing Group).]
Fig. 3.
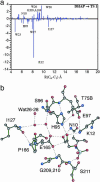
Mechanism of TIM. (a) Electrostatic contribution of individual residues (in kcal/mol on the ordinate) to the lowering of the activation energy barrier (TS1) of the reaction of the DHAP substrate to form the enolate intermediate. This is the rate-determining step of the overall chemical reaction. The residues are plotted on the abscissa as a function of the distance from the Cα carbon of the residue [or the oxygen of a water molecule (W)] to C1 of the substrate. Negative values correspond to the lowering of the barrier. (b) Active-site structure at transition state showing important residues and water molecules. [Reproduced with permission from ref. (Copyright 2004, AAAS).]
Fig. 4.
F1 ATPase and targeted molecular dynamics. (a) Structure of Fo–F1 ATP synthase based on crystal structures of the F1 ATPase (51, 52). The Fo component is indicated as a gray cylinder within the membrane (yellow), and the γ-subunit shaft is shown in green. The three α-subunits are indicated by blue backbone traces, and the molecular surfaces of the three β-subunits are shown. The γ-subunit rotates in a clockwise direction during ATP synthesis, as viewed from the membrane, and the effects of a 120° rotation of the γ-subunit are manifested as a change in the conformation of the β-subunits. (b) Schematic representation of targeted molecular dynamics. The simulated structure is restrained to be at a specified rms distance from the target structure, and this distance is gradually decreased during the simulation. Because the restraint is applied in an overall rms sense, the intermediate structures are not specified explicitly and different parts of the structure can relax toward the final structures at different rates.
Fig. 5.
Structure and dynamics of the Src and Abl kinases. (Left) The structures of c-Abl (green) and c-Src (red) are shown superimposed on their SH2 and SH3 domains (69, 70, 75). Note the dissimilarity in the conformation of the kinase domains. (Center and Right) The results of unbiased molecular dynamics simulations of c-Src. Residues in different domains that move in a correlated manner in the simulation are linked by a red line. These correlations were calculated by superimposing each instantaneous structure in the simulation on the C-terminal lobe of the kinase domain, and motions that are correlated to the C-terminal lobe are removed by this procedure. (Right) The mutation of residues in the SH2–SH3 linker to glycine reduces the correlation in the dynamics of these domains. Similar results were obtained for c-Abl. (Modified from refs. and 75).
Similar articles
- Computational analysis of the binding specificity of Gleevec to Abl, c-Kit, Lck, and c-Src tyrosine kinases.
Lin YL, Roux B. Lin YL, et al. J Am Chem Soc. 2013 Oct 2;135(39):14741-53. doi: 10.1021/ja405939x. Epub 2013 Sep 20. J Am Chem Soc. 2013. PMID: 24001034 Free PMC article. - A Src-like inactive conformation in the abl tyrosine kinase domain.
Levinson NM, Kuchment O, Shen K, Young MA, Koldobskiy M, Karplus M, Cole PA, Kuriyan J. Levinson NM, et al. PLoS Biol. 2006 May;4(5):e144. doi: 10.1371/journal.pbio.0040144. Epub 2006 May 2. PLoS Biol. 2006. PMID: 16640460 Free PMC article. - Energetic dissection of Gleevec's selectivity toward human tyrosine kinases.
Agafonov RV, Wilson C, Otten R, Buosi V, Kern D. Agafonov RV, et al. Nat Struct Mol Biol. 2014 Oct;21(10):848-53. doi: 10.1038/nsmb.2891. Epub 2014 Sep 14. Nat Struct Mol Biol. 2014. PMID: 25218445 Free PMC article. - Protein tyrosine kinases: autoregulation and small-molecule inhibition.
Hubbard SR. Hubbard SR. Curr Opin Struct Biol. 2002 Dec;12(6):735-41. doi: 10.1016/s0959-440x(02)00383-4. Curr Opin Struct Biol. 2002. PMID: 12504677 Review. - Understanding protein folding: small proteins in silico.
Zimmermann O, Hansmann UH. Zimmermann O, et al. Biochim Biophys Acta. 2008 Jan;1784(1):252-8. doi: 10.1016/j.bbapap.2007.10.010. Epub 2007 Nov 6. Biochim Biophys Acta. 2008. PMID: 18036571 Free PMC article. Review.
Cited by
- Revealing Atomic-Level Mechanisms of Protein Allostery with Molecular Dynamics Simulations.
Hertig S, Latorraca NR, Dror RO. Hertig S, et al. PLoS Comput Biol. 2016 Jun 10;12(6):e1004746. doi: 10.1371/journal.pcbi.1004746. eCollection 2016 Jun. PLoS Comput Biol. 2016. PMID: 27285999 Free PMC article. Review. - FAST UPDATING MULTIPOLE COULOMBIC POTENTIAL CALCULATION.
HÖft TA, Alpert BK. HÖft TA, et al. SIAM J Sci Comput. 2017 Jun 6;39(3):https://doi.org/10.1137/16M1096189. SIAM J Sci Comput. 2017. PMID: 33088167 Free PMC article. - ALiBERO: evolving a team of complementary pocket conformations rather than a single leader.
Rueda M, Totrov M, Abagyan R. Rueda M, et al. J Chem Inf Model. 2012 Oct 22;52(10):2705-14. doi: 10.1021/ci3001088. Epub 2012 Sep 17. J Chem Inf Model. 2012. PMID: 22947092 Free PMC article. - Simulations of a protein crystal with a high resolution X-ray structure: evaluation of force fields and water models.
Cerutti DS, Freddolino L, Duke RE Jr, Case DA. Cerutti DS, et al. J Phys Chem B. 2010 Oct 14;114(40):12811-24. doi: 10.1021/jp105813j. J Phys Chem B. 2010. PMID: 20860388 Free PMC article. - Selective characterization of microsecond motions in proteins by NMR relaxation.
Hansen DF, Feng H, Zhou Z, Bai Y, Kay LE. Hansen DF, et al. J Am Chem Soc. 2009 Nov 11;131(44):16257-65. doi: 10.1021/ja906842s. J Am Chem Soc. 2009. PMID: 19842628 Free PMC article.
References
- Karplus, M. & McCammon, J. A. (2002) Nat. Struct. Biol. 9, 646–652. - PubMed
- Wang, W., Donini, O., Reyes, C. M. & Kollman, P. A. (2001) Annu. Rev. Biophys. Biomol. Struct. 30, 211–243. - PubMed
- Hansson, T., Oostenbrink, C. & van Gunsteren, W. (2002) Curr. Opin. Struct. Biol. 12, 190–196. - PubMed
- McCammon, J. A., Gelin, B. R. & Karplus, M. (1977) Nature 267, 585–590. - PubMed
MeSH terms
Substances
LinkOut - more resources
Full Text Sources
Other Literature Sources
Miscellaneous


