Transforming growth factor beta-activated kinase 1 is a key mediator of ovine follicle-stimulating hormone beta-subunit expression - PubMed (original) (raw)
Transforming growth factor beta-activated kinase 1 is a key mediator of ovine follicle-stimulating hormone beta-subunit expression
Nedal Safwat et al. Endocrinology. 2005 Nov.
Abstract
FSH, a key regulator of gonadal function, contains a beta-subunit (FSHbeta) that is transcriptionally induced by activin, a member of the TGFbeta-superfamily. This study used 4.7 kb of the ovine FSHbeta-promoter linked to luciferase (oFSHbetaLuc) plus a well-characterized activin-responsive construct, p3TPLuc, to investigate the hypothesis that Smad3, TGFbeta-activated kinase 1 (TAK1), or both cause activin-mediated induction of FSH. Overexpression of either Smad3 or TAK1 induced oFSHbetaLuc in gonadotrope-derived LbetaT2 cells as much as activin itself. Induction of p3TPLuc by activin is known to require Smad3 activation in many cell types, and this was true in LbetaT2 cells, where 10-fold induction by activin (2-8 h after activin treatment) was blocked more than 90% by two dominant negative (DN) inhibitors of Smad3 [DN-Smad3 (3SA) and DN-Smad3 (D407E)]. By contrast, 6.5-fold induction of oFSHbetaLuc by activin (10-24 h after activin treatment) was not blocked by either DN-Smad inhibitor, suggesting that activation of Smad3 did not trigger induction of oFSHbetaLuc. By contrast, inhibition of TAK1 by a DN-TAK1 construct led to a 50% decrease in activin-mediated induction of oFSHbetaLuc, and a specific inhibitor of TAK1 (5Z-7-Oxozeanol) blocked induction by 100%, indicating that TAK1 is necessary for activin induction of oFSHbetaLuc. Finally, inhibiting p38-MAPK (often activated by TAK1) blocked induction of oFSHbetaLuc by 60%. In conclusion, the data presented here indicate that activation of TAK1 (and probably p38-MAPK), but not Smad3, is necessary for triggering induction of oFSHbeta by activin.
Figures
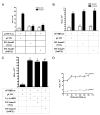
Fig. 1
Overexpression of Smad3 equally stimulated basal and activin-induced expression of oFSHβLuc. LβT2 cells were plated at 25,000 cells/well in 96-well tissue culture plates. After 24 h, they were cotransfected with 50 ng oFSHβLuc and increasing amounts of Smad3 expression construct (25, 50, 75, 100, and 125 ng). DNA amounts were kept constant at 200 ng DNA transfected per well using pCMV (mock plasmid) to balance amounts of DNA. After transfection (24 h), cells were treated with or without activin (100 ng/ml) for an additional 24 h and assayed for luciferase activity. Ratios of induced/basal were not significantly different from the 5.7 ± 1.6 ratio observed in control cultures not transfected with Smad3 (P > 0.05). One-way ANOVA/Tukey’s was used to show that increasing levels of Smad3 increased luciferase expression; a significant increase between points (P < 0.05) was designated: #, for basal expression; *, for activin-stimulated expression. RLU, Relative light units.
Fig. 2
Activin did not require activated Smad3 to induce oFSHβLuc expression. LβT2 cells were prepared and plated as in Fig. 1 and then treated as follows: A, Cells were cotransfected with 50 ng p3TPLux plus 50 ng pCMV, DN-Smad3 (3SA), or DN-Smad3 (D407E). After transfection (24 h), cells were treated with or without activin (100 ng/ml) for an additional 6 h and assayed for luciferase activity. Means with different letters are significantly different (P < 0.05) (_P_ < 0.001 for c _vs._ d). B, Cells were treated as in A except that oFSHβLuc was used instead of p3TPLux. _Means with different letters_ are significantly different (_P_ < 0.05). C, Cells were transfected with 50 ng oFSHβLuc plus 100 ng pCMV (column 1) or 50 ng pCMV and 50 ng Ca-ActRIB (column 2). Columns 3 and 4 were transfected with 50 ng of either DN-Smad3 (SA) or DN-Smad3 (D407E) in place of pCMV. Cells were collected 24 h after transfection and assayed for luciferase activity. _Means with different letters_ are significantly different (_P_ < 0.05). D, Cells were cotransfected with 50 ng oFSHβLuc and increasing amounts of DN-Smad3 (3SA) expression construct (25, 50, 75, 100, 125, and 150 ng). Total DNA amounts were kept constant using mock plasmid pCMV. Twenty-four hours after transfection, cells were treated with or without activin (100 ng/ml) for an additional 24 h. Ratios of induced/basal were not significantly different from the 5.5 ± 0.22 ratio observed in control cultures not transfected with DN-Smad3 (3SA) (_P_ > 0.05).
Fig. 3
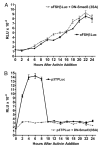
Different kinetics for oFSHβLuc and p3TPLux induction by activin. LβT2 cells were prepared and plated as in Fig. 1. A, Cells were cotransfected with 50 ng oFSHβLuc plus either 50 ng pCMV (▪) or 50 ng Smad3 (3SA) (▴). After transfection (24 h), triplicate cultures were sequentially treated with activin (100 ng/ml) every 2 h for 24 h. There was no significant increase in expression for the first 6 h of activin treatment for either control or DN-Smad3 (3SA)-transfected cells. Cells treated with activin for 8 h or longer showed significant increases in expression, but there was no significant difference at any time point between cultures transfected with pCMV (control) or DN-Smad3 (3SA). B, Cells were treated as in A, except p3TPLux was used instead of oFSHβLuc. All cultures treated with activin showed, at least, a significant doubling of expression at all time points (P < 0.05). Expression increased further (P < 0.001), up to 9.3-fold, between 2 and 8 h, in the absence of DN-Smad3 (3SA), but DN-Smad3 totally blocked this increase.
Fig. 4
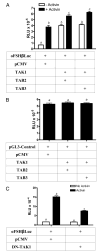
TAB2 or TAB3 partner with TAK1 to induce expression of oFSHβLuc like activin. LβT2 cells were prepared and plated as in Fig. 1. A, Cells were transiently cotransfected with 50 ng oFSHβLuc and 150 ng pCMV as mock DNA, or oFSHβLuc and 25 ng TAK1, and 125 ng of either TAB2 or TAB3. Twenty-four hours after transfection, cells were treated with or without activin (100 ng/ml), for an additional 24 h before analysis. Means with different letters are significantly different (P < 0.05). B, Cells were transiently cotransfected with 50 ng pGL3-control and either 150 ng mock plasmid pCMV or 25 ng TAK1 plus 125 ng TAB2 or TAB3. After transfection (24 h), cells were assayed for luciferase activity. The results of these treatments were not significantly different (_P_ > 0.05). C, Cells were transiently cotransfected with 50 ng oFSHβLuc and 50 ng of either mock plasmid pCMV or expression vector encoding the TAK1 DN (DN-TAK1-KN). After 24 h of transfection, cells were treated with or without activin (100 ng/ml) for an additional 24 h. Means with different letters are significantly different (P < 0.01).
Fig. 5
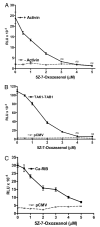
Inhibition of TAK1 with 5Z-7-Oxozeanol fully blocked activin induction of oFSHβLuc expression. LβT2 cells were prepared and plated as in Fig. 1. A, Cells were transiently transfected with 50 ng oFSHβLuc promoter construct for 24 h. Cells were then treated with or without 5Z-7-Oxozeanol at the indicated concentrations for 2 h before treatment with (▴) or without activin (▪) at 100 ng. Cells were incubated another 24 h before analysis for luciferase activity. Because 5Z-7-Oxozeanol is reported to be somewhat labile, halfway through the 24-h incubation, fresh media was added containing the same concentrations of 5Z-7-Oxozeanol and activin. Treatment with 5Z-7-Oxozeanol significantly inhibited induction of oFSHβLuc at all concentrations (P < 0.05) and completely inhibited it between 3–5 μM (ns, not significantly different from unstimulated control cultures). B, Cells were cotransfected with 50 ng oFSHβLuc and 50 ng pCMV mock DNA (▴) or 50 ng oFSHβLuc, 25 ng TAK1, and 25 ng TAB1 expression constructs (▪). After transfection (24 h), cells were treated with increasing concentrations of 5Z-7-Oxozeanol as in A above. Treatment with 5Z-7-Oxozeanol significantly inhibited induction of oFSHβLuc at all concentrations (P < 0.05) and completely inhibited it at 4 μM and above (ns). C, Cells were transiently cotransfected with 50 ng oFSHβLuc and 50 ng of either mock plasmid pCMV (▴) or expression vector encoding the Ca-ActRIB (▪). After transfection (24 h), cells were treated with increasing concentrations of 5Z-7-Oxozeanol as in A above. Treatment with 5Z-7-Oxozeanol significantly inhibited induction of oFSHβLuc at all concentrations (P < 0.05).
Fig. 6
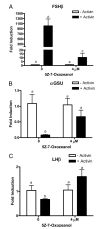
LβT2 cells were plated in 6-well plates at 1 million cells per well. The cells were treated with or without activin (100 ng/ml) and treated with or without 4 μM 5Z-7-Oxozeanol. Cells were incubated for 24 h and then washed with PBS, and total RNA was extracted using Tri-Zol reagent. Threshold cycle (Ct) values for (A) FSHβ, (B) αGSU, and (C) LHβ were normalized by subtracting their respective 18s rRNA Ct values. Neither activin nor 5Z-7-Oxozeanol altered 18s rRNA levels because Ct values for 18s rRNA did not change significantly (P > 0.05). Normalized Ct values were averaged and used to compare FSHβ, αGSU, and LHβ in the absence or presence of activin using the 2−(ΔΔCt) method for quantitation. The data are plotted as fold-induction of mRNA levels above basal expression. Means with different letters are significantly different (P < 0.05).
Fig. 7
Activin phosphorylated TAK1 within 2 h and maintained TAK1 activation for 24 h. LβT2 cells were plated at 1 million cells per well in 6-well plates. Cells were pretreated with follistatin-288 (250 ng/ml; 16 h) and washed with culture media. Cells were then treated with activin (100 ng/ml) for 0, 15, or 30 min or 1, 2, 4, 6, 8, 12, 16, 20, or 24 h. Phosphorylation of endogenous TAK1 was detected by Western blot analysis as described in Materials and Methods.
Fig. 8
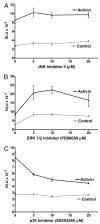
Inhibition of p38-MAPK partially blocks activin induction of oFSHβ. LβT2 cells were prepared and plated as in Fig. 1A and transiently transfected with 50 ng oFSHβLuc. A, After transfection (24 h), cells were treated with or without activin (100 ng/ml) and with JNK inhibitor II (0, 5, 10, and 20 μM); B, the same as A but using the ERK inhibitor; C, the same as A but using the p38 MAPK inhibitor (0, 5, 10, and 20 μM). Cultures were treated for 24 h with or without inhibitors and then analyzed for luciferase activity. Only SB203580 significantly decreased the ratio of induction/basal expression (P < 0.05).
Similar articles
- Transforming growth factor-beta modulates inhibin A bioactivity in the LbetaT2 gonadotrope cell line by competing for binding to betaglycan.
Ethier JF, Farnworth PG, Findlay JK, Ooi GT. Ethier JF, et al. Mol Endocrinol. 2002 Dec;16(12):2754-63. doi: 10.1210/me.2002-0014. Mol Endocrinol. 2002. PMID: 12456797 - Both SMAD2 and SMAD3 mediate activin-stimulated expression of the follicle-stimulating hormone beta subunit in mouse gonadotrope cells.
Bernard DJ. Bernard DJ. Mol Endocrinol. 2004 Mar;18(3):606-23. doi: 10.1210/me.2003-0264. Epub 2003 Dec 30. Mol Endocrinol. 2004. PMID: 14701940 - A FoxL in the Smad house: activin regulation of FSH.
Coss D, Mellon PL, Thackray VG. Coss D, et al. Trends Endocrinol Metab. 2010 Sep;21(9):562-8. doi: 10.1016/j.tem.2010.05.006. Epub 2010 Jul 2. Trends Endocrinol Metab. 2010. PMID: 20598900 Free PMC article. Review.
Cited by
- Normal gonadotropin production and fertility in gonadotrope-specific Bmpr1a knockout mice.
Zhou X, Wang Y, Ongaro L, Boehm U, Kaartinen V, Mishina Y, Bernard DJ. Zhou X, et al. J Endocrinol. 2016 Jun;229(3):331-41. doi: 10.1530/JOE-16-0053. Epub 2016 Mar 30. J Endocrinol. 2016. PMID: 27029473 Free PMC article. - 5Z-7-Oxozeanol Inhibits the Effects of TGFβ1 on Human Gingival Fibroblasts.
Kuk H, Hutchenreuther J, Murphy-Marshman H, Carter D, Leask A. Kuk H, et al. PLoS One. 2015 Apr 30;10(4):e0123689. doi: 10.1371/journal.pone.0123689. eCollection 2015. PLoS One. 2015. PMID: 25927238 Free PMC article. - Paired-like homeodomain transcription factors 1 and 2 regulate follicle-stimulating hormone beta-subunit transcription through a conserved cis-element.
Lamba P, Khivansara V, D'Alessio AC, Santos MM, Bernard DJ. Lamba P, et al. Endocrinology. 2008 Jun;149(6):3095-108. doi: 10.1210/en.2007-0425. Epub 2008 Mar 13. Endocrinology. 2008. PMID: 18339718 Free PMC article. - Activin B can signal through both ALK4 and ALK7 in gonadotrope cells.
Bernard DJ, Lee KB, Santos MM. Bernard DJ, et al. Reprod Biol Endocrinol. 2006 Oct 13;4:52. doi: 10.1186/1477-7827-4-52. Reprod Biol Endocrinol. 2006. PMID: 17040568 Free PMC article. - Activin A stimulates migration of the fallopian tube epithelium, an origin of high-grade serous ovarian cancer, through non-canonical signaling.
Dean M, Davis DA, Burdette JE. Dean M, et al. Cancer Lett. 2017 Apr 10;391:114-124. doi: 10.1016/j.canlet.2017.01.011. Epub 2017 Jan 20. Cancer Lett. 2017. PMID: 28115208 Free PMC article.
References
- Kumar TR, Wang Y, Lu N, Matzuk MM. Follicle stimulating hormone is required for ovarian follicle maturation but not male fertility. Nat Genet. 1997;15:201–204. - PubMed
- Besecke LM, Guendner MJ, Schneyer AL, Bauer-Dantoin AC, Jameson JL, Weiss J. Gonadotropin-releasing hormone regulates follicle-stimulating hormone-β gene expression through an activin/follistatin autocrine or para-crine loop. Endocrinology. 1996;137:3667–3673. - PubMed
- Dalkin AC, Haisenleder DJ, Ortolano GA, Ellis TR, Marshall JC. The frequency of gonadotropin-releasing-hormone stimulation differentially regulates gonadotropin subunit messenger ribonucleic acid expression. Endocrinology. 1989;125:917–924. - PubMed
- Haisenleder DJ, Ortolano GA, Dalkin AC, Ellis TR, Paul SJ, Marshall JC. Differential regulation of gonadotropin subunit gene expression by gonadotropin-releasing hormone pulse amplitude in female rats. Endocrinology. 1990;127:2869–2875. - PubMed
- Huang HJ, Wu JC, Su P, Zhirnov O, Miller WL. A novel role for bone morphogenetic proteins in the synthesis of follicle-stimulating hormone. Endocrinology. 2001;142:2275–2283. - PubMed
Publication types
MeSH terms
Substances
LinkOut - more resources
Full Text Sources
Miscellaneous

