Inflammation-induced lymphangiogenesis in the cornea arises from CD11b-positive macrophages - PubMed (original) (raw)
. 2005 Sep;115(9):2363-72.
doi: 10.1172/JCI23874.
Masaaki Ii, Claus Cursiefen, David G Jackson, Hiroshi Keino, Minoru Tomita, Nico Van Rooijen, Hideya Takenaka, Patricia A D'Amore, Joan Stein-Streilein, Douglas W Losordo, J Wayne Streilein
Affiliations
- PMID: 16138190
- PMCID: PMC1193872
- DOI: 10.1172/JCI23874
Inflammation-induced lymphangiogenesis in the cornea arises from CD11b-positive macrophages
Kazuichi Maruyama et al. J Clin Invest. 2005 Sep.
Abstract
In the inflamed cornea, there is a parallel outgrowth of blood and lymphatic vessels into the normally avascular cornea. We tested whether adaptive and/or innate immune cells were actively involved in the genesis of new lymphatic vessels. Our results indicate that innate immune cells (CD11b+ macrophages, but not CD11c+ dendritic cells) physically contributed to lymphangiogenesis under pathological conditions and that bone marrow-derived CD11b+ macrophages expressed lymphatic endothelial markers such as LYVE-1 and Prox-1 under inflamed conditions in the corneal stromata of mice. Furthermore, blood vascular endothelial cells that expressed the Tie2 promoter did not contribute to newly formed lymphatic vessels under inflamed conditions. Our in vitro experiments demonstrated that CD11b+ macrophages alone were capable of forming tube-like structures that expressed markers of lymphatic endothelium such as LYVE-1 and podoplanin. The novel finding that CD11b+ macrophages are critical for the development of inflammation-dependent lymphangiogenesis in the eye suggests a new mechanism of lymphangiogenesis.
Figures
Figure 1
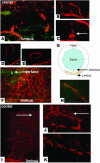
Initial (3–7 days) and late (56 days) phases of lymphangiogenesis after PKP. (A) Hemangiogenesis (green) and lymphangiogenesis (orange) in the corneal stromal layer 3 days after PKP. The blood vessel structures appear to originate from cellular aggregates. (B and C) The dendritic-shaped cells aggregate and appear to anastomose with limbal lymphatic vessels 3 days after PKP. (D and E) A discrete lymphatic vessel (D) and its 3D image (E). (F) Lymphatic vessels reach the interface (arrow) between donor and host 7 days after PKP. (G) Diagram of eye structure after corneal transplantation showing location of blood vessels (green) and lymphatic vessels (orange). (H) LYVE-1 (orange) and FITC-conjugated CD31 (PECAM-1; green) staining of explanted culture cornea after stimulation with IL-1β. (I–K) Fifty-six days after PKP, the inflammation is suppressed, and lymphatic vessels regress. Arrows indicate interrupted structure and appearance of dendritic-shape cells. Magnification, ×100 (A, F, and I); ×200 (B and J); ×400 (C, H, and K). Scale bar: 40 μm (D).
Figure 2
Comparison of hemangiogenesis and lymphangiogenesis after PKP. (A–C) Photomicrographs of immunofluorescence images 7 days after PKP. (A) Allogeneic (Allo) transplantation. (B) Allogeneic transplantation in SCID mice. (C) Syngeneic transplantation. (D and E) Spot image analysis of lymphangiogenesis visualized by LYVE-1 staining (red) (D) and hemangiogenesis (green) (E) detected by PECAM-1 staining in each transplantation group. (F) Allogeneic transplantation in presensitized hosts. (G and H) Spot image analysis of lymphangiogenesis (G) and hemangiogenesis (H) in each transplantation group. Magnification, ×100.
Figure 3
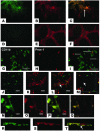
Lymphatic vascular endothelium after PKP and suture placement. (A–F) Fluorescence microscopy. FITC-conjugated CD11b (A) and Cy3-visualized LYVE-1 (B) staining. (C) Overlay of A and B showing dual expression of markers. FITC-conjugated CD11c (D) and Cy3-visualized LYVE-1 (E) staining. (F) Overlay of D and E showing dual expression. (G–T) Confocal microscopy. FITC-conjugated CD11b (G) and Cy3-visualized Prox-1 (H) staining. (I) Overlay of G and H showing dual expression. FITC-conjugated CD11b (J) and Cy3-visualized Prox-1 (K) staining. (L) Overlay of G and K showing dual expression. (M) Horizontal section image (bottom) and coronary section image (right) of the lymphatic vessel. (N–Q) EGFP bone marrow cells (green) appear to be part of the lymphatic endothelium or wall. EGFP expression (N) and Cy3-visualized LYVE-1 (O) staining. (P) Overlay of N and O showing dual expression. (Q) Horizontal section image (bottom) and coronary section image (right) of the lymphatic wall. (R–T) Three-dimensional image of a lymphatic vessel. EGFP expression (R) and Cy3-visualized LYVE-1 (S) staining. (T) Overlay of P and R showing dual expression. Arrows indicate lymphatic vessel lumen. Magnification, ×100 (A–F). Scale bars: 16 μm (G–M); 8 μm (N–Q).
Figure 4
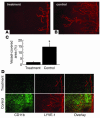
Effect of macrophage depletion on lymphangiogenesis after suture placement. (A and B) Spot image analysis of lymphangiogenesis visualized by LYVE-1 staining (red) in each group. (A) Clodoronate liposomes (treatment); (B) PBS-containing liposomes (control). (C) Quantification of lymphatic vessel invasion 7 days after suture placement (n = 5). (D) Immunofluorescence images showing CD11b (green) and LYVE-1 (red) staining 7 days after suture placement in mice treated with clodoronate liposomes or PBS-containing liposomes.*P < 0.0005. Magnification, ×100.
Figure 5
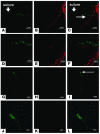
Involvement of EPCs in lymphatic vascular development following corneal suture. (A–C) Tie2-LacZ mouse cornea. Cy2-visualized β-gal (A) and Cy3-visualized LYVE-1 (B) staining. (C) Overlay of A and B showing dual expression. (D–F) Higher magnification view of area indicated by arrows in A and C. Cy2-visualized β-gal (D) and Cy3-visualized LYVE-1 (E) staining. (F) Overlay of E and F showing dual expression. (G–I) LacZ expression at the blood vessel, not lymphatic in Tie2-LacZ chimera mouse cornea. Cy2-visualized β-gal (G) and Cy3-visualized LYVE-1 (H) staining. (I) Overlay of G and H showing dual expression. (J–L) Higher magnification view of area indicated by arrow in I. Cy2-visualized β-gal (J) and Cy3-visualized LYVE-1 (K) staining. (L) Overlay of J and K showing dual expression. Scale bars: 80 μm (A–C and G–I), 40 μm (D–F), and 20 μm (J–L).
Figure 6
Characterization of PECs. (A) Flow cytometric analysis of thioglycollate-activated adherent PECs. Percentage of PECs positive for CD11b is shown. The x axis shows FITC fluorescence intensity. (B) RT-PCR of CD11b+ macrophages. Shown are CD11b macrophages stimulated with thioglycollate VEGFR-3 (lane 1), VEGFR-2 (lane 3), and VEGF-C (lane 5) and their unstimulated counterparts (lanes 2, 4, and 6, respectively). The far left lane provides size markers. (C) Multicolor FACS analysis of CD11b+ macrophages. Percentages of double-positive cells are shown. (D–L) Immunocytochemistry of thioglycollate-activated adherent PECs. PE-conjugated CD11b (D) and FITC-visualized Prox-1 (E) staining. (F) Overlay of D and E showing dual expression. PE-conjugated CD11b (G) and FITC-visualized podoplanin (H) staining. (I) Overlay of G and H showing dual expression. PE-conjugated CD11b (J) and FITC-visualized LYVE-1 (K) staining; (L) overlay of J and K showing dual expression. Magnification, ×400.
Figure 7
Behavior of PEC in a tube-formation assay. (A and B) Matrigel assay at day 3 containing 105 cells/ml. (A) PECs appear to be aligning end-to-end in the assay (arrowheads). (B) PECs associating to form a vessel-like structure. (C) Measurement of aggregation and tube-like structure field in the Matrigel assay at day 2. (D–S) Long-term (31 days) assay containing 2 × 10⁶ cells/ml. (D and E) Micrograph of the tube-like structure in the Matrigel (31 days). (F–H) Another area of a Matrigel assay (day 31) containing 2 × 10⁶ cells/ml. Shown are sequential images of upper (G), middle (H), and lower (I) levels of matrigel cultures. (J) Horizontal view of images in G–I. (K, M, and O) Matrigel assay at day 31 containing 2 × 10⁶ cells/ml. (L and N) Cy3-visualized podoplanin staining and nuclear staining with DAPI (blue). (P) Fluorescence microscopy image of matrigel cultures. Arrow depicts area evaluated by confocal microscopy in Q–S. (Q–S) Confocal image of Matrigel at day 31. EGFP expression (Q) and Cy3-visualized LYVE-1 staining and nuclear staining with DAPI (P and R). (S) Overlay of Q and R showing dual expression. Magnification, ×100 (A, C, and F); ×200 (B, D, and K–P); ×400 (E and G–I). Scale bars in Q–S: 20 μm.
Figure 8
TEM image of a tube-like structure formed by CD11b+ PECs. (A and B) Three-dimensional visualization of CD11b+ macrophage tube formation (described in Figure 6) at day 7 of Matrigel assay. Panel B shows a higher magnification of the region in A indicated by the arrow. (C–G) Tube-like structure in Matrigel assay. (C) Lumen (Lu) formed by CD11b+ macrophages. Panels D, F, and G show higher magnification views of the regions in C indicated by the large arrow, small arrow, and arrowhead, respectively. Panel E shows a higher magnification view of the region in D indicated by the arrow. Magnifications are as indicated in each panel.
Comment in
- The crucial role of macrophages in lymphangiogenesis.
Kerjaschki D. Kerjaschki D. J Clin Invest. 2005 Sep;115(9):2316-9. doi: 10.1172/JCI26354. J Clin Invest. 2005. PMID: 16138185 Free PMC article.
Similar articles
- The maintenance of lymphatic vessels in the cornea is dependent on the presence of macrophages.
Maruyama K, Nakazawa T, Cursiefen C, Maruyama Y, Van Rooijen N, D'Amore PA, Kinoshita S. Maruyama K, et al. Invest Ophthalmol Vis Sci. 2012 May 31;53(6):3145-53. doi: 10.1167/iovs.11-8010. Invest Ophthalmol Vis Sci. 2012. PMID: 22511631 - Lymphatic endothelium-specific hyaluronan receptor LYVE-1 is expressed by stabilin-1+, F4/80+, CD11b+ macrophages in malignant tumours and wound healing tissue in vivo and in bone marrow cultures in vitro: implications for the assessment of lymphangiogenesis.
Schledzewski K, Falkowski M, Moldenhauer G, Metharom P, Kzhyshkowska J, Ganss R, Demory A, Falkowska-Hansen B, Kurzen H, Ugurel S, Geginat G, Arnold B, Goerdt S. Schledzewski K, et al. J Pathol. 2006 May;209(1):67-77. doi: 10.1002/path.1942. J Pathol. 2006. PMID: 16482496 - The effect of podoplanin inhibition on lymphangiogenesis under pathological conditions.
Maruyama Y, Maruyama K, Kato Y, Kajiya K, Moritoh S, Yamamoto K, Matsumoto Y, Sawane M, Kerjaschki D, Nakazawa T, Kinoshita S. Maruyama Y, et al. Invest Ophthalmol Vis Sci. 2014 Jul 1;55(8):4813-22. doi: 10.1167/iovs.13-13711. Invest Ophthalmol Vis Sci. 2014. PMID: 24985477 - [The macrophage contribution for maintaining lymphatic vessel in cornea].
Maruyama K. Maruyama K. Nippon Ganka Gakkai Zasshi. 2014 Nov;118(11):953-7. Nippon Ganka Gakkai Zasshi. 2014. PMID: 25543386 Review. Japanese. - Molecular and cellular mechanisms of lymphangiogenesis.
Al-Rawi MA, Mansel RE, Jiang WG. Al-Rawi MA, et al. Eur J Surg Oncol. 2005 Mar;31(2):117-21. doi: 10.1016/j.ejso.2004.08.015. Eur J Surg Oncol. 2005. PMID: 15698725 Review.
Cited by
- Involvement of corneal lymphangiogenesis in a mouse model of allergic eye disease.
Lee HS, Hos D, Blanco T, Bock F, Reyes NJ, Mathew R, Cursiefen C, Dana R, Saban DR. Lee HS, et al. Invest Ophthalmol Vis Sci. 2015 May;56(5):3140-8. doi: 10.1167/iovs.14-16186. Invest Ophthalmol Vis Sci. 2015. PMID: 26024097 Free PMC article. - Eyes are essential for magnetoreception in a mammal.
Caspar KR, Moldenhauer K, Moritz RE, Němec P, Malkemper EP, Begall S. Caspar KR, et al. J R Soc Interface. 2020 Sep;17(170):20200513. doi: 10.1098/rsif.2020.0513. Epub 2020 Sep 30. J R Soc Interface. 2020. PMID: 32993431 Free PMC article. - Plasmacytoid dendritic cells in the eye.
Jamali A, Kenyon B, Ortiz G, Abou-Slaybi A, Sendra VG, Harris DL, Hamrah P. Jamali A, et al. Prog Retin Eye Res. 2021 Jan;80:100877. doi: 10.1016/j.preteyeres.2020.100877. Epub 2020 Jul 24. Prog Retin Eye Res. 2021. PMID: 32717378 Free PMC article. Review. - Leishmania major Infection-Induced VEGF-A/VEGFR-2 Signaling Promotes Lymphangiogenesis That Controls Disease.
Weinkopff T, Konradt C, Christian DA, Discher DE, Hunter CA, Scott P. Weinkopff T, et al. J Immunol. 2016 Sep 1;197(5):1823-31. doi: 10.4049/jimmunol.1600717. Epub 2016 Jul 29. J Immunol. 2016. PMID: 27474074 Free PMC article. - Proangiogenic Function of T Cells in Corneal Transplantation.
Di Zazzo A, Tahvildari M, Subbarayal B, Yin J, Dohlman TH, Inomata T, Mashaghi A, Chauhan SK, Dana R. Di Zazzo A, et al. Transplantation. 2017 Apr;101(4):778-785. doi: 10.1097/TP.0000000000001390. Transplantation. 2017. PMID: 27490416 Free PMC article.
References
- Cursiefen C, Chen L, Dana MR, Streilein JW. Corneal lymphangiogenesis: evidence, mechanisms, and implications for corneal transplant immunology [review] Cornea. 2003;22:273–281. - PubMed
- Streilein JW, Yamada J, Dana MR, Ksander BR. Anterior chamber-associated immune deviation, ocular immune privilege, and orthotopic corneal allografts. Transplant. Proc. 1999;31:1472–1475. - PubMed
- Dana MR, Streilein JW. Loss and restoration of immune privilege in eyes with corneal neovascularization. Invest. Ophthalmol. Vis. Sci. 1996;37:2485–2494. - PubMed
- Jackson DG. New molecular markers for the study of tumour lymphangiogenesis. Anticancer Res. 2001;21:4279–4283. - PubMed
Publication types
MeSH terms
Substances
Grants and funding
- EY05318/EY/NEI NIH HHS/United States
- R01 EY010765/EY/NEI NIH HHS/United States
- EY11893/EY/NEI NIH HHS/United States
- R01 EY005318/EY/NEI NIH HHS/United States
- EY10765/EY/NEI NIH HHS/United States
LinkOut - more resources
Full Text Sources
Other Literature Sources
Research Materials
Miscellaneous


