Lower expression of genes near microRNA in C. elegans germline - PubMed (original) (raw)
Lower expression of genes near microRNA in C. elegans germline
Hidenori Inaoka et al. BMC Bioinformatics. 2006.
Abstract
Background: MicroRNAs (miRNAs) are recently discovered short non-protein-coding RNA molecules. miRNAs are increasingly implicated in tissue-specific transcriptional control and particularly in development. Because there is mounting evidence for the localized component of transcriptional control, we investigated if there is a distance-dependent effect of miRNA.
Results: We analyzed gene expression levels around the 84 of 113 know miRNAs for which there are nearby gene that were measured in the data in two independent C. elegans expression data sets. The expression levels are lower for genes in the vicinity of 59 of 84 (71%) miRNAs as compared to genes far from such miRNAs. Analysis of the genes with lower expression in proximity to the miRNAs reveals increased frequency matching of the 7 nucleotide "seed"s of these miRNAs.
Conclusion: We found decreased messenger RNA (mRNA) abundance, localized within a 10 kb of chromosomal distance of some miRNAs, in C. elegans germline. The increased frequency of seed matching near miRNA can explain, in part, the localized effects.
Figures
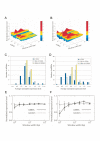
Figure 1
Localized decrease in mRNA levels near miRNAs. A and B, The expression levels around each miRNA are plotted against the window width (A: data by Kim et al. [7] and B: germline data [8]). It should be noted that only 83 and 84 miRNAs are shown in A and B, respectively. This is because no protein-coding genes are found near the other miRNAs. Also miRNAs, which were close to each other, having the same expression values of surrounding genes were grouped and treated as a cluster. The information on the numbering of the axis labeled "miRNA" in Figure 1A and 1B is found in supplemental files. C and D, Distributions of the normalized average expression in the 10 kb window (C: Kim and D: germline data) (see the navy blue bars). In these histograms, distributions of the normalized averages in other distance ranges are also plotted: the light blue and yellow bars represent a distance range between 10 kb and 100 kb and a distance range between 100 kb and 1000 kb, respectively. E and F, The average expression levels over all miRNAs are shown (E: Kim and F: germline data). The normalized expression levels of randomly selected genes are also shown in these graphs.
Figure 2
A subset of Kim data, which were obtained from germ cells, showed a stronger effect.
Figure 3
The number of seed pairings around genes in different distance ranges. Both spliced and unspliced mRNA forms of protein-coding genes were investigated.
Similar articles
- Spatiotemporal m(i)RNA Architecture and 3' UTR Regulation in the C. elegans Germline.
Diag A, Schilling M, Klironomos F, Ayoub S, Rajewsky N. Diag A, et al. Dev Cell. 2018 Dec 17;47(6):785-800.e8. doi: 10.1016/j.devcel.2018.10.005. Epub 2018 Nov 8. Dev Cell. 2018. PMID: 30416012 - Degradome sequencing reveals an endogenous microRNA target in C. elegans.
Park JH, Ahn S, Kim S, Lee J, Nam JW, Shin C. Park JH, et al. FEBS Lett. 2013 Apr 2;587(7):964-9. doi: 10.1016/j.febslet.2013.02.029. Epub 2013 Feb 26. FEBS Lett. 2013. PMID: 23485825 - A genome-wide map of conserved microRNA targets in C. elegans.
Lall S, Grün D, Krek A, Chen K, Wang YL, Dewey CN, Sood P, Colombo T, Bray N, Macmenamin P, Kao HL, Gunsalus KC, Pachter L, Piano F, Rajewsky N. Lall S, et al. Curr Biol. 2006 Mar 7;16(5):460-71. doi: 10.1016/j.cub.2006.01.050. Epub 2006 Feb 2. Curr Biol. 2006. PMID: 16458514 - Transcriptional control of microRNA expression in C. elegans: promoting better understanding.
Turner MJ, Slack FJ. Turner MJ, et al. RNA Biol. 2009 Jan-Mar;6(1):49-53. doi: 10.4161/rna.6.1.7574. Epub 2009 Jan 9. RNA Biol. 2009. PMID: 19106630 Free PMC article. Review. - Single-cell sequencing of miRNAs: A modified technology.
Chakraborty C, Bhattacharya M, Agoramoorthy G. Chakraborty C, et al. Cell Biol Int. 2020 Sep;44(9):1773-1780. doi: 10.1002/cbin.11376. Epub 2020 May 18. Cell Biol Int. 2020. PMID: 32379363 Review.
Cited by
- Global analysis of microRNA target gene expression reveals that miRNA targets are lower expressed in mature mouse and Drosophila tissues than in the embryos.
Yu Z, Jian Z, Shen SH, Purisima E, Wang E. Yu Z, et al. Nucleic Acids Res. 2007;35(1):152-64. doi: 10.1093/nar/gkl1032. Epub 2006 Dec 7. Nucleic Acids Res. 2007. PMID: 17158157 Free PMC article. - Comprehensive exploration of the effects of miRNA SNPs on monocyte gene expression.
Greliche N, Zeller T, Wild PS, Rotival M, Schillert A, Ziegler A; Cardiogenics Consortium; Deloukas P, Erdmann J, Hengstenberg C, Ouwehand WH, Samani NJ, Schunkert H, Munzel T, Lackner KJ, Cambien F, Goodall AH, Tiret L, Blankenberg S, Trégouët DA. Greliche N, et al. PLoS One. 2012;7(9):e45863. doi: 10.1371/journal.pone.0045863. Epub 2012 Sep 21. PLoS One. 2012. PMID: 23029284 Free PMC article. - Evidence of spatially bound gene regulation in Mus musculus: decreased gene expression proximal to microRNA genomic location.
Inaoka H, Fukuoka Y, Kohane IS. Inaoka H, et al. Proc Natl Acad Sci U S A. 2007 Mar 20;104(12):5020-5. doi: 10.1073/pnas.0611078104. Epub 2007 Mar 12. Proc Natl Acad Sci U S A. 2007. PMID: 17360362 Free PMC article.
References
Publication types
MeSH terms
Substances
Grants and funding
- P01 CA92644/CA/NCI NIH HHS/United States
- P01 CA092644/CA/NCI NIH HHS/United States
- P01 NS040828/NS/NINDS NIH HHS/United States
- TO1DK60837-01A1/DK/NIDDK NIH HHS/United States
- HL73030-02/HL/NHLBI NIH HHS/United States
- R01 HL073030/HL/NHLBI NIH HHS/United States
- R01 DK060837/DK/NIDDK NIH HHS/United States
- P01 NS 40828-01/NS/NINDS NIH HHS/United States
LinkOut - more resources
Full Text Sources


