A sensitive array for microRNA expression profiling (miChip) based on locked nucleic acids (LNA) - PubMed (original) (raw)
A sensitive array for microRNA expression profiling (miChip) based on locked nucleic acids (LNA)
Mirco Castoldi et al. RNA. 2006 May.
Abstract
MicroRNAs represent a class of short (approximately 22 nt), noncoding regulatory RNAs involved in development, differentiation, and metabolism. We describe a novel microarray platform for genome-wide profiling of mature miRNAs (miChip) using locked nucleic acid (LNA)-modified capture probes. The biophysical properties of LNA were exploited to design probe sets for uniform, high-affinity hybridizations yielding highly accurate signals able to discriminate between single nucleotide differences and, hence, between closely related miRNA family members. The superior detection sensitivity eliminates the need for RNA size selection and/or amplification. MiChip will greatly simplify miRNA expression profiling of biological and clinical samples.
Figures
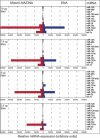
FIGURE 1.
Mixed DNA/LNA capture probes display increased sensitivity for miRNA detection. miRNA expression was assessed in murine liver using a test set of LNA-modified (left) or unmodified DNA oligonucleotide capture probes (right). Decreasing amounts of total RNA were used as input material for miRNA analysis. Data are presented as median intensity (four replicas per miRNA capture probe; a representative experiment is shown).
FIGURE 2.
Accurate miRNA detection in murine heart and liver samples using Tm normalized LNA-modified capture probes. Detection of miRNA expression by PM (
p
erfect
m
atch; 100% complementarity to the miRNA sequence), 1MM (single nucleotide
m
is
m
atch at the central position of the nucleotide sequence of the mature miRNA), and 2MM (two nucleotide mismatches at the central position) LNA-modified captures probes. Data are presented as median intensity ± SD (four replicas per miRNA capture probe; a representative experiment is shown).
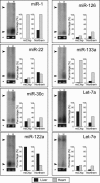
FIGURE 3.
Confirmation of miChip data by Northern blotting. Eight miRNAs were selected for comparative analysis as described in the text. The _Y_-axis of the miChip graph refers to the background-corrected averaged mean fluorescence intensities of four replicas normalized for U6 RNA expression, while the _Y_-axis in the Northern blot graph refers to background-corrected intensities (as calculated by ImageJ). For both the miChip and the Northern blot data, the signal corresponding to the miRNA with the highest signal intensity (miR-1) was set to 100%, and signals for the additional miRNAs analyzed were calculated as a percentage thereof. Ethidium bromide stained 5S RNA (*) is shown as a loading control. Arrows indicate the position of the pre-miRNAs (top arrow, ∼65 nt) and of the mature miRNAs (bottom arrow, ∼22 nt).
FIGURE 4.
Genome-wide miRNA profiling using miChip. miRNA expression profiles were monitored across four mouse tissues (duodenum [“Duod.”], spleen, heart, and liver). Data were organized according to the expression levels of individual miRNAs (condition tree). The key color bar indicates miRNA expression levels (dark red indicates high expression, while dark blue indicates no detectable expression; the Genespring data file is presented in Supplemental Table 5).
Similar articles
- miChip: a microarray platform for expression profiling of microRNAs based on locked nucleic acid (LNA) oligonucleotide capture probes.
Castoldi M, Benes V, Hentze MW, Muckenthaler MU. Castoldi M, et al. Methods. 2007 Oct;43(2):146-52. doi: 10.1016/j.ymeth.2007.04.009. Methods. 2007. PMID: 17889802 - miChip: an array-based method for microRNA expression profiling using locked nucleic acid capture probes.
Castoldi M, Schmidt S, Benes V, Hentze MW, Muckenthaler MU. Castoldi M, et al. Nat Protoc. 2008;3(2):321-9. doi: 10.1038/nprot.2008.4. Nat Protoc. 2008. PMID: 18274534 - Sensitive and specific detection of microRNAs by northern blot analysis using LNA-modified oligonucleotide probes.
Válóczi A, Hornyik C, Varga N, Burgyán J, Kauppinen S, Havelda Z. Válóczi A, et al. Nucleic Acids Res. 2004 Dec 14;32(22):e175. doi: 10.1093/nar/gnh171. Nucleic Acids Res. 2004. PMID: 15598818 Free PMC article. - The utility of LNA in microRNA-based cancer diagnostics and therapeutics.
Stenvang J, Silahtaroglu AN, Lindow M, Elmen J, Kauppinen S. Stenvang J, et al. Semin Cancer Biol. 2008 Apr;18(2):89-102. doi: 10.1016/j.semcancer.2008.01.004. Epub 2008 Jan 15. Semin Cancer Biol. 2008. PMID: 18295505 Review. - Strategies for profiling microRNA expression.
Kong W, Zhao JJ, He L, Cheng JQ. Kong W, et al. J Cell Physiol. 2009 Jan;218(1):22-5. doi: 10.1002/jcp.21577. J Cell Physiol. 2009. PMID: 18767038 Review.
Cited by
- Surface Enzyme Chemistries for Ultrasensitive Microarray Biosensing with SPR Imaging.
Fasoli JB, Corn RM. Fasoli JB, et al. Langmuir. 2015 Sep 8;31(35):9527-36. doi: 10.1021/la504797z. Epub 2015 Feb 10. Langmuir. 2015. PMID: 25641598 Free PMC article. - Opportunities and challenges for selected emerging technologies in cancer epidemiology: mitochondrial, epigenomic, metabolomic, and telomerase profiling.
Verma M, Khoury MJ, Ioannidis JP. Verma M, et al. Cancer Epidemiol Biomarkers Prev. 2013 Feb;22(2):189-200. doi: 10.1158/1055-9965.EPI-12-1263. Epub 2012 Dec 14. Cancer Epidemiol Biomarkers Prev. 2013. PMID: 23242141 Free PMC article. Review. - Inflammation-Mediated Regulation of MicroRNA Expression in Transplanted Pancreatic Islets.
Bravo-Egana V, Rosero S, Klein D, Jiang Z, Vargas N, Tsinoremas N, Doni M, Podetta M, Ricordi C, Molano RD, Pileggi A, Pastori RL. Bravo-Egana V, et al. J Transplant. 2012;2012:723614. doi: 10.1155/2012/723614. Epub 2012 May 10. J Transplant. 2012. PMID: 22655170 Free PMC article. - Concise review: MicroRNA expression in multipotent mesenchymal stromal cells.
Lakshmipathy U, Hart RP. Lakshmipathy U, et al. Stem Cells. 2008 Feb;26(2):356-63. doi: 10.1634/stemcells.2007-0625. Epub 2007 Nov 8. Stem Cells. 2008. PMID: 17991914 Free PMC article. Review. - NF-kappaB p65-dependent transactivation of miRNA genes following Cryptosporidium parvum infection stimulates epithelial cell immune responses.
Zhou R, Hu G, Liu J, Gong AY, Drescher KM, Chen XM. Zhou R, et al. PLoS Pathog. 2009 Dec;5(12):e1000681. doi: 10.1371/journal.ppat.1000681. Epub 2009 Dec 4. PLoS Pathog. 2009. PMID: 19997496 Free PMC article.
References
- Braasch D.A., Corey D.R. Locked nucleic acid (LNA): Fine-tuning the recognition of DNA and RNA. Chem. Biol. 2001;8:1–7. - PubMed
Publication types
MeSH terms
Substances
LinkOut - more resources
Full Text Sources
Other Literature Sources
Research Materials


