Role for TLR2 in NK cell-mediated control of murine cytomegalovirus in vivo - PubMed (original) (raw)
Role for TLR2 in NK cell-mediated control of murine cytomegalovirus in vivo
Eva Szomolanyi-Tsuda et al. J Virol. 2006 May.
Abstract
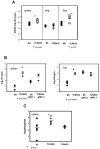
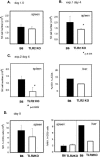
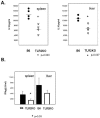
Natural killer (NK) cells are essential for the early control of murine cytomegalovirus (MCMV) infection. Here, we demonstrate that toll-like receptor 2 (TLR2) plays a role in the NK cell-mediated control of MCMV. TLR2 knockout (KO) mice had elevated levels of MCMV in the spleen and liver on day 4 postinfection compared to C57BL/6 mice. In vivo depletion of NK cells with anti-NK1.1 antibodies, however, eliminated the differences in viral titers between the two groups, suggesting that the effect of TLR2 on MCMV clearance on day 4 was NK cell mediated. The defect in early antiviral control was associated with a decreased NK cell population in the spleen and liver and reduced amounts of interleukin-18 and alpha/beta interferon secreted in the TLR2 KO mice. Our studies suggest that in addition to the reported involvement of TLR9 and TLR3, TLR2 is also involved in innate immune responses to MCMV infection.
Figures
FIG. 1.
MCMV titers in organs of wild-type C57BL/6 and TLR2 KO mice. (A) Viral titers in spleens, lungs, and livers of C57BL/6 and TLR2 KO mice on day 4 postinfection, determined by plaque assay. Four or five mice per group were infected with 2 × 10⁴ PFU MCMV. The asterisks indicate statistically significant differences. The P values were determined by Student's t test. (B) Viral titers in wild-type and TLR2 KO mice after in vivo NK cell depletion. Mice were infected with 5 × 10⁵ PFU MCMV intraperitoneally. NK cell depletions were performed on the day before infection in the indicated groups. The plaque assays were performed with homogenates of organs harvested on day 4 postinfection. The limit of detection of the plaque assays was 20 plaques per organ (log 1.3) in the spleens and 200 plaques per organ (log 2.3) in the livers. Three or four mice per group were tested. (C) Comparison of spleen titers of MCMV in wild-type, TLR2 KO, and TLR4 KO mice (on identical B6-backbred backgrounds). The mice were infected with 2 × 10⁴ PFU MCMV intraperitoneally, and six mice per group were tested. The asterisk indicates statistically significant differences between wild-type and TLR2 KO mice. The horizontal lines indicate the mean values.
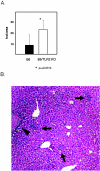
FIG. 2.
MCMV-induced liver pathology in C57BL/6 and TLR2 KO mice. (A) Increased numbers of inflammatory foci in HE-stained liver sections of MCMV-infected TLR2 KO mice on day 3 postinfection. The foci were counted under a microscope using low magnification (×40) by evaluating two fields per liver sample (five or six mice per group). The error bars indicate standard deviations. (B) Liver pathology on day 4 following MCMV infection in TLR2 KO mice. An HE-stained tissue section is shown at ×100 magnification; the arrows point to the inflammatory foci, and the arrowhead indicates a necrotic area.
FIG. 3.
NK cell populations in the spleens and livers of MCMV-infected C57BL/6 mice and TLR2 KO mice. (A) Numbers of NK1.1+ CD3− NK cells in the spleen leukocyte populations of wild-type and TLR2 KO mice on day 1.5 postinfection. Four mice per group were infected with 2 × 10⁴ PFU MCMV. The error bars indicate standard deviations. (B) Experiment 1: numbers of NK1.1+ CD3− NK cells in the spleens of wild-type and TLR2 KO mice on day 4 postinfection. The asterisk indicates a statistically significant difference. (C) Experiment 2: numbers and percentages of NK1.1+ CD3− NK cells in the spleens and livers on day 4. The percentage in the liver was determined using pooled cells obtained from four livers per group. (D) Numbers and percentages of NK1.1+ CD3− NK cells in the spleens and livers on day 8.
FIG. 4.
Cytokine levels in the spleens of MCMV-infected wild-type and TLR2-deficient mice. (A) IL-18 concentrations in organ extracts harvested on day 1.5 postinfection and determined by ELISAs. Four mice per group were tested. (B) IFN-α/β concentrations determined by bioassays of organ extracts harvested on day 1.5 postinfection (n = 4/group). Student's t test was used to calculate P values. The asterisk indicates statistical significance. The error bars indicate standard deviations. The horizontal bars indicate the mean values.
Similar articles
- MyD88-dependent and -independent murine cytomegalovirus sensing for IFN-alpha release and initiation of immune responses in vivo.
Delale T, Paquin A, Asselin-Paturel C, Dalod M, Brizard G, Bates EE, Kastner P, Chan S, Akira S, Vicari A, Biron CA, Trinchieri G, Brière F. Delale T, et al. J Immunol. 2005 Nov 15;175(10):6723-32. doi: 10.4049/jimmunol.175.10.6723. J Immunol. 2005. PMID: 16272328 - The IFN regulatory factor 7-dependent type I IFN response is not essential for early resistance against murine cytomegalovirus infection.
Steinberg C, Eisenächer K, Gross O, Reindl W, Schmitz F, Ruland J, Krug A. Steinberg C, et al. Eur J Immunol. 2009 Apr;39(4):1007-18. doi: 10.1002/eji.200838814. Eur J Immunol. 2009. PMID: 19283778 - Natural killer cells promote early CD8 T cell responses against cytomegalovirus.
Robbins SH, Bessou G, Cornillon A, Zucchini N, Rupp B, Ruzsics Z, Sacher T, Tomasello E, Vivier E, Koszinowski UH, Dalod M. Robbins SH, et al. PLoS Pathog. 2007 Aug 24;3(8):e123. doi: 10.1371/journal.ppat.0030123. PLoS Pathog. 2007. PMID: 17722980 Free PMC article. - MCMV avoidance of recognition and control by NK cells.
Brizić I, Lenac Roviš T, Krmpotić A, Jonjić S. Brizić I, et al. Semin Immunopathol. 2014 Nov;36(6):641-50. doi: 10.1007/s00281-014-0441-9. Epub 2014 Aug 21. Semin Immunopathol. 2014. PMID: 25141793 Review. - Resisting viral infection: the gene by gene approach.
Moresco EM, Beutler B. Moresco EM, et al. Curr Opin Virol. 2011 Dec;1(6):513-8. doi: 10.1016/j.coviro.2011.10.005. Epub 2011 Nov 6. Curr Opin Virol. 2011. PMID: 22440911 Free PMC article. Review.
Cited by
- Live or let die: manipulation of cellular suicide programs by murine cytomegalovirus.
Handke W, Krause E, Brune W. Handke W, et al. Med Microbiol Immunol. 2012 Nov;201(4):475-86. doi: 10.1007/s00430-012-0264-z. Epub 2012 Sep 11. Med Microbiol Immunol. 2012. PMID: 22965170 Review. - NK Cell Development in Times of Innate Lymphoid Cell Diversity.
Stokic-Trtica V, Diefenbach A, Klose CSN. Stokic-Trtica V, et al. Front Immunol. 2020 Jul 8;11:813. doi: 10.3389/fimmu.2020.00813. eCollection 2020. Front Immunol. 2020. PMID: 32733432 Free PMC article. Review. - Type I interferon and NF-κB activation elicited by herpes simplex virus gH/gL via αvβ3 integrin in epithelial and neuronal cell lines.
Gianni T, Leoni V, Campadelli-Fiume G. Gianni T, et al. J Virol. 2013 Dec;87(24):13911-6. doi: 10.1128/JVI.01894-13. Epub 2013 Oct 9. J Virol. 2013. PMID: 24109241 Free PMC article. - Natural killer cell activation by dendritic cells: balancing inhibitory and activating signals.
Barreira da Silva R, Münz C. Barreira da Silva R, et al. Cell Mol Life Sci. 2011 Nov;68(21):3505-18. doi: 10.1007/s00018-011-0801-8. Epub 2011 Aug 23. Cell Mol Life Sci. 2011. PMID: 21861182 Free PMC article. Review. - The inflammasome as a target of modulation by DNA viruses.
Amsler L, Malouli D, DeFilippis V. Amsler L, et al. Future Virol. 2013 Apr 1;8(4):357-370. doi: 10.2217/fvl.13.22. Future Virol. 2013. PMID: 24955107 Free PMC article.
References
- Akira, S., K. Takeda, and T. Kaisho. 2001. Toll-like receptors: critical proteins linking innate and aquired immunity. Nat. Immunol. 2:675-680. - PubMed
- Alexopoulou, L., et al. 2001. Recognition of double-stranded RNA and activation of NF-κB by Toll-like receptor 3. Nature 413:732-738. - PubMed
- Andrews, D. M., et al. 2003. Functional interactions between dendritic cells and NK cells during viral infection. Nat. Immunol. 4:175-181. - PubMed
- Arase, H., et al. 2002. Direct recognition of cytomegalovirus by activating and inhibitory NK cell receptors. Science 296:1323-1326. - PubMed
- Bell, J. K., et al. 2003. Leucine-rich repeats and pathogen recognition in Toll-like receptors. Trends Immunol. 24:528-533. - PubMed
Publication types
MeSH terms
Substances
Grants and funding
- R01 AI051405/AI/NIAID NIH HHS/United States
- CA66644/CA/NCI NIH HHS/United States
- R01 AI049309/AI/NIAID NIH HHS/United States
- AI51415/AI/NIAID NIH HHS/United States
- R01 CA034461/CA/NCI NIH HHS/United States
- R01 CA066644/CA/NCI NIH HHS/United States
- R01 AI051415/AI/NIAID NIH HHS/United States
- AI49309/AI/NIAID NIH HHS/United States
- CA34461/CA/NCI NIH HHS/United States
LinkOut - more resources
Full Text Sources
Other Literature Sources
Molecular Biology Databases
Research Materials


