Dose-dependent effects of stable cyclin B1 on progression through mitosis in human cells - PubMed (original) (raw)
Dose-dependent effects of stable cyclin B1 on progression through mitosis in human cells
Frank Wolf et al. EMBO J. 2006.
Abstract
The disassembly of the mitotic spindle and exit from mitosis require the inactivation of Cdk1. Here, we show that expression of nondegradable cyclinB1 causes dose-dependent mitotic arrest phenotypes. By monitoring chromosomes in living cells, we determined that pronounced overexpression of stable cyclinB1 entailed metaphase arrest without detectable sister chromatid separation, while moderate overexpression arrested cells in a pseudometaphase state, in which separated sister chromatids were kept at the cellular equator by a bipolar 'metaphase-like' spindle. Chromosomes that left the pseudometaphase plate became pulled back and individual kinetochores were found to be merotelically attached to both spindle poles in stable cyclinB1 arrested cells. Inactivation of the chromokinesin hKid, by RNAi or antibody microinjection, prevented the formation of stable bipolar spindles and the 'metaphase-like' alignment of chromosomes in cells expressing stable cyclinB1. These experiments show that cyclinB1 is able to maintain a bipolar spindle even after sister chromatids had become separated and suggest an important role of hKid in this process. Cells expressing low levels of nondegradable cyclinB1 progressed further in mitosis and arrested in telophase.
Figures
Figure 1
Nondegradable cyclinB1 arrests cells in mitosis. (A) Onk2H2B-GFP-mB1dm cells were induced for 24 h using 400 ng/ml dox and analysed for cyclinB1 expression using mouse-specific mAb V143 and V152 that recognises both mouse and human cyclin B1. The mB1dm expression level in relation to endogenous cyclin B1 as determined by densitometry of the autoradiograph is depicted underneath the blots. (B) Phase contrast and fluorescence images were taken at 10 and 20 h after induction of Onk2-H2B-GFP mB1dm cells. (C) Onk2-mB1dm-GFP cells were treated with 400 ng/ml dox (lanes 2–4) and 500 nM nocodazole for 16 h (lane 4). Total protein extracts were analysed for cyclinB1 expression at the indicated time points after induction using mAb V152, detected and quantified using an infrared scanner. (D) Phase contrast and fluorescence (mB1dm-GFP) images were taken at 0 and 24 h after induction. (E) mB1dm-GFP cells induced for 24 h and treated with nocodazole for 16 h were fixed with paraformaldehyde, permeabilized and stained for cyclinB1 using mAb V152. Panels show phase contrast, GFP fluorescence and cyclinB1 immunofluorescence images and a quantification of GFP fluorescence and cyclinB1 immunofluorescence pixel intensities/cell. Cells were classified according to GFP signals (GFP*, NA=not applicable in noninduced cells) and average GFP signals plotted against average cyclinB1 pixel intensities.
Figure 2
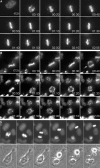
‘Pseudometaphase' arrest induced by nondegradable cyclinB1. Onk2-H2B-GFP-mB1NΔ157 cells were synchronised and induced to express mB1NΔ157. Cells about to enter mitosis were filmed using a × 32 objective and images were taken every 2.5 min. For details see text. Time=h:min:s.
Figure 3
Metaphase and telophase arrest phenotypes induced by nondegradable cyclinB1. (A) Synchronised Onk2-H2B-GFP-mB1NΔ157 cells were induced and monitored by time-lapse videomicroscopy as in Figure 2. Selected time frames of a representative cell arrested in metaphase are shown (time=h:min). (B) About 22% of arrested cells underwent anaphase (arrow) and initiated cytokinesis, while chromosomes remained condensed. (C) A cytoplasmic connection (arrow) remained in cells arrested in telophase.
Figure 4
Mitotic arrest phenotypes correlate with cyclinB1 expression levels. (A) Onk2 H2B-mRFP mB1dm-GFP cells were induced for 24 h using 1 μg/ml dox and monitored for progression through mitosis by live cell imaging using a × 40 objective. Representative cells with high, medium and low GFP signals and selected corresponding time frames of histone H2B-mRFP recordings are shown. *Image was contrast enhanced to visualise the GFP signal. (B, C) For quantification, cells were monitored using a × 10 objective. The average GFP pixel intensities in cells displaying one of the three cellular arrest phenotypes is shown in (B), while the relative frequency of phenotypes in groups of cells displaying similar GFP intensities is shown in (C).
Figure 5
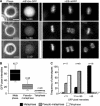
Sister chromatid separation in cells arrested with nondegradable cyclinB1. (A) Mitotic Onk2 mB1dm cells were harvested 24 h after induction and analysed by chromosome spreading. One metaphase cell and one cell arrested in anaphase are shown. Size bar indicates 5 μm. The bar graph shows a summary of mB1dm and mB1NΔ157 cells induced for 24 h and analysed by chromosome spreading. White bars=metaphase cells; black bars=anaphase cells (_n_>100 in both cell lines). (B) Chromosome spread analysis of transiently transfected mitotic HeLa cells. A cell arrested at metaphase by nocodazole treatment for 16 h is shown as a control. A representative chromosome spread of a HeLa cells transfected with mB1dm is shown (anaphase). The bar graph summarises experiments using HeLa cells that were transiently transfected with the indicated plasmids (_n_>100 for each transfection experiment). (C) Left panel: Total cell extracts from adherent interphase (I) or mitotic (M) Onk2-mB1NΔ157 cells that were either left untreated (lanes 1 and 4), nocodazole treated (0.5 μM, 16 h, lane 2), 4 h released from a 16 h nocodazole block (lane 3), or dox-treated (lanes 4 and 5) were analysed for Cdc27, cyclin B1 and Cdc2. G1=G1 phase. Right panel: total cell extracts from nonmitotic (lane 1) and mitotic (lane 2) nocodazole-treated as well as nonmitotic (lane 3) and mitotic dox-induced (lane 4) mB1NΔ157 cells were analysed for securin and GAPDH expression by immunoblotting.
Figure 6
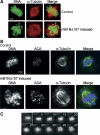
The mitotic spindle is maintained in arrested cells. (A) Like control cells (top row), arrested cells contain a bipolar spindle as visualised by staining of methanol fixed mB1NΔ157 expressing Onk2-H2B-GFP cells for α-tubulin (Tat-1, Alexa546). (B) Kinetochores are not paired in Onk2 mB1dm arrested cells (2nd row): kinetochores were stained using an anticentromere antibody (ACA) positive CREST serum (FITC) in combination with α-tubulin (Alexa546) staining in Onk2-H2B-GFP cells expressing nondegradable cyclinB1. Confocal images were taken at 1 μm _z_-sections. (C) Induced H2B-GFP expressing Onk2-mB1NΔ157 arrested cells were monitored to undergo anaphase and re-assemble their chromosomes at the cellular equator, then treated with 0.5 μM nocodazole and followed by fluorescence time-lapse video-microscopy (_n_=4). Time after addition of nocodazole is shown in min. Size bar is 10 μm.
Figure 7
Merotelic kinetochore attachment in cells arrested by nondegradable cyclinB1. (A) Images of H2B-GFP signals of induced mB1NΔ157 cells were taken in 30 s. intervals using a × 40 objective. Shown are selected time frames of Supplementary Movie 4 with the elapsed time indicated in min:s. A chromosome discussed in the text is highlighted by red pseudocoloring. The lower panel shows an oscillating, slower moving, chromosome, which does not change its shape as it moves back (Supplementary Movie 5). (B) Model for the metaphase-like arrangement of anaphase chromosomes in stable cyclinB1 arrested cells. In the absence of cyclinB1 degradation, separated sister chromatids might achieve a metaphase-like arrangement by merotelic attachment, a ‘strong polar wind' or by a combination of both. (C) Kinetochore microtubule bundles (α-tubulin) and kinetochores (ACA=CREST) were stained after selective depletion of nonkinetochore microtubules and are shown as maximum projections of deconvolved 0.5 μm _z_-series taken with a × 63 objective. The bottom row shows the overlay of the α-tubulin and kinetochore stainings and an enlarged area to highlight monotelically (arrows) as well as merotelically attached (arrowhead) kinetochores. (D) mB1NΔ157 induced arrested cells were treated with 20 μM R-roscovitine and followed by live cell imaging. The selected cell shown attempts a futile cytokinesis, which appears to be blocked by nonsegregating chromatin remaining in between the middle of the cell (arrow). Size bar=10 μm. Time=h:min.
Figure 8
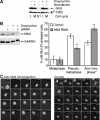
(A) hKid is required for the metaphase-like reassembly of anaphase chromosomes in arrested cells. hKid is expressed in cells arrested by nondegradable cyclinB1 (legend as in Figure 5C). Cdc2 levels are shown as loading controls. (B) hKid RNAi. Onk2 cells were transfected with 50 nM hKid siRNAs for 6 h, induced to express cyclin mB1NΔ157 for 24 h and monitored by time-lapse videomicroscopy. At 26 h after transfection, cells were harvested and analysed for hKid protein expression (left panel). Right panel: Summary of time-lapse analysis of induced mB1NΔ157 cells transfected with hKid specific (grey bars) or nonspecific siRNAs (white bars). Progression through mitosis was monitored by observing H2B-GFP signals in more than 200 cells over more than 12 h by fluorescence time-lapse videomicroscopy. Shown are the frequencies of mitotic phenotypes of one out of three independent experiments with similar results (**_t_-test P<0.001). (**C**) Synchronised and induced Onk2-H2B-GFP mB1NΔ157 expressing cells were microinjected with affinity purified rabbit antiserum (10 mg/ml) directed against the DNA binding domain of hKid and followed by time-lapse video microscopy using a × 10 objective. Injected cells were identified by co-injected Rhodamine-labelled dextran. The representative cell shown (left panel) enters mitosis and after the onset of anaphase displays rapidly moving scattered chromosomes. The majority (>50%) of noninjected cells (a representative cell is shown in the right panel) displayed the pseudometaphase arrest. Time=h:min.
Similar articles
- Cyclin B1 is localized to unattached kinetochores and contributes to efficient microtubule attachment and proper chromosome alignment during mitosis.
Chen Q, Zhang X, Jiang Q, Clarke PR, Zhang C. Chen Q, et al. Cell Res. 2008 Feb;18(2):268-80. doi: 10.1038/cr.2008.11. Cell Res. 2008. PMID: 18195732 - Essential roles for cohesin in kinetochore and spindle function in Xenopus egg extracts.
Kenney RD, Heald R. Kenney RD, et al. J Cell Sci. 2006 Dec 15;119(Pt 24):5057-66. doi: 10.1242/jcs.03277. J Cell Sci. 2006. PMID: 17158911 - The chromokinesin, KLP3A, dives mitotic spindle pole separation during prometaphase and anaphase and facilitates chromatid motility.
Kwon M, Morales-Mulia S, Brust-Mascher I, Rogers GC, Sharp DJ, Scholey JM. Kwon M, et al. Mol Biol Cell. 2004 Jan;15(1):219-33. doi: 10.1091/mbc.e03-07-0489. Epub 2003 Oct 3. Mol Biol Cell. 2004. PMID: 14528012 Free PMC article. - '... The end of the beginning': cdk1 thresholds and exit from mitosis.
Wolf F, Sigl R, Geley S. Wolf F, et al. Cell Cycle. 2007 Jun 15;6(12):1408-11. Epub 2007 Apr 27. Cell Cycle. 2007. PMID: 17581279 Review. - Merotelic kinetochores in mammalian tissue cells.
Salmon ED, Cimini D, Cameron LA, DeLuca JG. Salmon ED, et al. Philos Trans R Soc Lond B Biol Sci. 2005 Mar 29;360(1455):553-68. doi: 10.1098/rstb.2004.1610. Philos Trans R Soc Lond B Biol Sci. 2005. PMID: 15897180 Free PMC article. Review.
Cited by
- Cellular contractility requires ubiquitin mediated proteolysis.
Cinnamon Y, Feine O, Hochegger H, Bershadsky A, Brandeis M. Cinnamon Y, et al. PLoS One. 2009 Jul 14;4(7):e6155. doi: 10.1371/journal.pone.0006155. PLoS One. 2009. PMID: 19597551 Free PMC article. - Connexin 43 enhances paclitaxel cytotoxicity in colorectal cancer cell lines.
Wang S, Zhang S, Zhao Z, Zhang C, Yang X, Wang Y. Wang S, et al. Exp Ther Med. 2017 Aug;14(2):1212-1218. doi: 10.3892/etm.2017.4589. Epub 2017 Jun 13. Exp Ther Med. 2017. PMID: 28810580 Free PMC article. - Spatiotemporal control of mitotic exit during anaphase by an aurora B-Cdk1 crosstalk.
Afonso O, Castellani CM, Cheeseman LP, Ferreira JG, Orr B, Ferreira LT, Chambers JJ, Morais-de-Sá E, Maresca TJ, Maiato H. Afonso O, et al. Elife. 2019 Aug 19;8:e47646. doi: 10.7554/eLife.47646. Elife. 2019. PMID: 31424385 Free PMC article. - Separase Control and Cohesin Cleavage in Oocytes: Should I Stay or Should I Go?
Wassmann K. Wassmann K. Cells. 2022 Oct 27;11(21):3399. doi: 10.3390/cells11213399. Cells. 2022. PMID: 36359795 Free PMC article. Review. - Inhibition of cell growth and induction of apoptosis in ovarian carcinoma cell lines CaOV3 and SKOV3 by natural withanolide Withaferin A.
Zhang X, Samadi AK, Roby KF, Timmermann B, Cohen MS. Zhang X, et al. Gynecol Oncol. 2012 Mar;124(3):606-12. doi: 10.1016/j.ygyno.2011.11.044. Epub 2011 Dec 3. Gynecol Oncol. 2012. PMID: 22188785 Free PMC article.
References
- Abramoff MD, Magelhaes PJ, Ram SJ (2004) Image processing with Image J. Biophotonics Int 11: 36–42
- Antonio C, Ferby I, Wilhelm H, Jones M, Karsenti E, Nebreda AR, Vernos I (2000) Xkid, a chromokinesin required for chromosome alignment on the metaphase plate. Cell 102: 425–435 - PubMed
- Ausserlechner MJ, Obexer P, Bock G, Geley S, Kofler R (2004) Cyclin D3 and c-MYC control glucocorticoid-induced cell cycle arrest but not apoptosis in lymphoblastic leukemia cells. Cell Death Differ 11: 165–174 - PubMed
- Chan GK, Yen TJ (2003) The mitotic checkpoint: a signaling pathway that allows a single unattached kinetochore to inhibit mitotic exit. Prog Cell Cycle Res 5: 431–439 - PubMed
Publication types
MeSH terms
Substances
LinkOut - more resources
Full Text Sources
Other Literature Sources
Molecular Biology Databases
Miscellaneous


