The in vivo pattern of AID targeting to immunoglobulin switch regions deduced from mutation spectra in msh2-/- ung-/- mice - PubMed (original) (raw)
The in vivo pattern of AID targeting to immunoglobulin switch regions deduced from mutation spectra in msh2-/- ung-/- mice
Kanmin Xue et al. J Exp Med. 2006.
Abstract
Immunoglobulin (Ig) class switching is initiated by deamination of C-->U within the immunoglobulin heavy chain locus, catalyzed by activation-induced deaminase (AID). In the absence of uracil-DNA glycosylase (UNG) and the homologue of bacterial MutS (MSH)-2 mismatch recognition protein, the resultant U:G lesions are not processed into switching events but are fixed by replication allowing sites of AID-catalyzed deamination to be identified by the resulting C-->T mutations. We find that AID targets cytosines in both donor and acceptor switch regions (S regions) with the deamination domains initiating approximately 150 nucleotides 3' of the I exon start sites and extending over several kilobases (the IgH intronic enhancer is spared). Culturing B cells with interleukin 4 or interferon gamma specifically enhanced deamination around Sgamma1 and Sgamma2a, respectively. Mutation spectra suggest that, in the absence of UNG and MSH2, AID may occasionally act at the mu switch region in an apparently processive manner, but there is no marked preference for targeting of the transcribed versus nontranscribed strand (even in areas capable of R loop formation). The data are consistent with switch recombination being triggered by transcription-associated, strand-symmetric AID-mediated deamination at both donor and acceptor S regions with cytokines directing isotype specificity by potentiating AID recruitment to the relevant acceptor S region.
Figures
Figure 1.
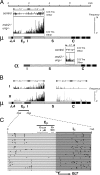
Distribution of Sμ-associated mutations. (A) Comparison of switch-associated mutations in wild-type and msh2 −/− ung −/− mice. Mutations in Sμ-associated regions m.1 and m.2 and in Sα-associated region a.2 were compared with Peyer's patch germinal center B cells from msh2 −/− ung −/− and wild-type mice. Mutations were categorized as either transitions at C:G pairs (plotted above the midline) or other (transversions at C:G or transitions/transversions at A:T, plotted below the midline). Mutations are plotted as vertical bars, with the height representing the frequency of mutations at each nucleotide calculated as the number of cases per set of 21 sequences in which that position is mutated. (B) Distribution of transition mutations at C:G pairs in germinal center B cells from Peyer's patches of a pair of msh2 −/− ung −/− mice (I and II). Four regions of ∼1.5 kb (m.1 to m.4) spanning from immediately downstream of JH4 to within the Cμ4 exon were sequenced (Table I). Mutations are plotted as vertical bars, with the height representing the frequency of mutations at each nucleotide calculated as the number of cases per set of 11 sequences in which that position is mutated. Position 1 in the sequence represents nucleotide 134,071 (available from GenBank/EMBL/DDBJ under accession no. AC073553). (C) Distribution of mutations in the vicinity of the Eμ enhancer. The data are represented as a composite of the transition mutations at C:G pairs identified in mice I and II, though similar distributions are evident when each mouse is analyzed individually. The region encompassing the heterogeneous start sites of the μ germline transcripts (GLT) is indicated. The asterisks designate the extents of the segments highlighted.
Figure 2.
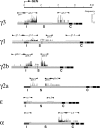
Distribution of Sγ-, ɛ-, and α-associated mutations. The distribution of transition mutations at C:G pairs around Sγ, ɛ, and α in the Peyer's patch germinal center B cells of msh2 −/− ung −/− mice I and II are presented as a compilation. Mice I and II showed similar distributions of mutations across the IgH locus when analyzed separately and contribute 143 and 210 sequences, respectively, to the compilation. The regions analyzed (0.8–1.9 kb in length) are indicated by opposing arrowheads. The results for each isotype are aligned to the major start sites of the germline transcripts, which are taken as nucleotides 41,758 (γ3), 68,759 (γ1), 93,343 (γ2b), and 111,899 (γ2a; available from GenBank/EMBL/DDBJ under accession no. AC161365); nucleotide 6225 (ɛ; available from GenBank/EMBL/DDBJ under accession no. CAAA01071548); and nucleotide 126 (α; available from GenBank/EMBL/DDBJ under accession no. D11468). Mutations are plotted as vertical bars with the height representing the frequency of mutations at each nucleotide calculated as the number of cases per set of 22 sequences in which that position is mutated.
Figure 3.
Absence of major strand polarity in Sμ-associated mutations. (A) Transition mutations at C:G pairs in regions m.1to m.4 were categorized as mutations at C on either the transcription template or nontemplate strand (TS or NTS, respectively) and accordingly plotted above or below a midline. (B) An expanded 720-bp region depicts in detail the distribution of NTS versus TS deaminations identified in four clones amplified by nested PCR from the repetitive region of Sμ. Position 1 corresponds to nucleotide 137,456 (available from GenBank/EMBL/DDBJ under accession no. AC073553). Of the 148 C→T transition mutations detected, 130 fell within a WRC motif, 49 were on the nontranscribed strand, and 99 were on the transcribed strand. Of the WRC motifs in this 720-bp region, 55% are found on the transcribed strand.
Figure 4.
Cytokine induction of switch-associated mutations in LPS-cultured B cells. (A) In vitro class switching of splenic B cells from a wild-type (control) C57BL/6 mouse analyzed by flow cytometry after a 7-d culture with LPS plus either IL-4 or IFN-γ. The numbers indicate the percentage of events in the top right quadrants. Results are representative of two independent experiments. (B) Germline transcription in the in vitro–stimulated splenic B cells. Germline transcripts comprising IH and CH exons of each isotype were detected by RT-PCR from RNA extracted at day 3 of culture. hprt, hypoxanthine phosphoribosyltransferase control. (C) Distribution of transitions at C:G pairs in genomic DNA purified from splenic B cells from msh2 −/− ung −/− mice after a 7-d culture with LPS plus IL-4 or IFN-γ as indicated. For each isotype, a region that had been demonstrated to be targeted by AID in vivo (Fig. 2) was amplified and sequenced. The number of sequenced for each region vary as a consequence of sequencing failures. Data shown are from two independent experiments.
Figure 5.
DNA strand polarity of switch-associated mutations in LPS-cultured B cells. (A) DNA strand polarity of C→T transition mutations in individual S region sequences amplified from splenic B cells from msh2 −/− ung −/− mice at day 7 of culture with LPS+IL-4/IFN-γ. (B) DNA strand polarity of C→T transition mutations in individual Sμ m.2 sequences amplified from splenic B cells from msh2 −/− ung −/− mice at day 5 of culture with LPS+IL-4/IFN-γ. All mutated sequences are illustrated with C→T transitions on the transcription template strand indicated by open circles below the line; those on the nontemplate strand are indicated by closed circles above the line. Asterisks mark sequences that harbor tandem C→T transitions on one strand in regions where other sequences in the database exhibit mutations on the opposite strand. Clusters of same DNA strand (linked) mutations were quantified by scoring the frequency of “same” (AA to TT) contiguous mutations (ignoring intervening distance) compared with the frequency of “different” (AT or TA) contiguous mutations in each sequence obtained from LPS-stimulated B cells. The bias in favor of same strand mutations was estimated using a χ2 test (P = 0.0277).
Similar articles
- AID recruits UNG and Msh2 to Ig switch regions dependent upon the AID C terminus [corrected].
Ranjit S, Khair L, Linehan EK, Ucher AJ, Chakrabarti M, Schrader CE, Stavnezer J. Ranjit S, et al. J Immunol. 2011 Sep 1;187(5):2464-75. doi: 10.4049/jimmunol.1101406. Epub 2011 Jul 29. J Immunol. 2011. PMID: 21804017 Free PMC article. - AID-associated DNA repair pathways regulate malignant transformation in a murine model of BCL6-driven diffuse large B-cell lymphoma.
Gu X, Booth CJ, Liu Z, Strout MP. Gu X, et al. Blood. 2016 Jan 7;127(1):102-12. doi: 10.1182/blood-2015-02-628164. Epub 2015 Sep 18. Blood. 2016. PMID: 26385350 Free PMC article. - Single-strand DNA breaks in Ig class switch recombination that depend on UNG but not AID.
Arudchandran A, Bernstein RM, Max EE. Arudchandran A, et al. Int Immunol. 2008 Nov;20(11):1381-93. doi: 10.1093/intimm/dxn097. Epub 2008 Sep 15. Int Immunol. 2008. PMID: 18794203 - Controlling somatic hypermutation in immunoglobulin variable and switch regions.
Maul RW, Gearhart PJ. Maul RW, et al. Immunol Res. 2010 Jul;47(1-3):113-22. doi: 10.1007/s12026-009-8142-5. Immunol Res. 2010. PMID: 20082153 Free PMC article. Review. - Molecular mechanisms of antibody somatic hypermutation.
Di Noia JM, Neuberger MS. Di Noia JM, et al. Annu Rev Biochem. 2007;76:1-22. doi: 10.1146/annurev.biochem.76.061705.090740. Annu Rev Biochem. 2007. PMID: 17328676 Review.
Cited by
- Determinants of sequence-specificity within human AID and APOBEC3G.
Carpenter MA, Rajagurubandara E, Wijesinghe P, Bhagwat AS. Carpenter MA, et al. DNA Repair (Amst). 2010 May 4;9(5):579-87. doi: 10.1016/j.dnarep.2010.02.010. Epub 2010 Mar 24. DNA Repair (Amst). 2010. PMID: 20338830 Free PMC article. - Kinase-dependent structural role of DNA-PKcs during immunoglobulin class switch recombination.
Crowe JL, Shao Z, Wang XS, Wei PC, Jiang W, Lee BJ, Estes VM, Alt FW, Zha S. Crowe JL, et al. Proc Natl Acad Sci U S A. 2018 Aug 21;115(34):8615-8620. doi: 10.1073/pnas.1808490115. Epub 2018 Aug 2. Proc Natl Acad Sci U S A. 2018. PMID: 30072430 Free PMC article. - AID and somatic hypermutation.
Maul RW, Gearhart PJ. Maul RW, et al. Adv Immunol. 2010;105:159-91. doi: 10.1016/S0065-2776(10)05006-6. Adv Immunol. 2010. PMID: 20510733 Free PMC article. Review. - Intrinsic transcriptional heterogeneity in B cells controls early class switching to IgE.
Wu YL, Stubbington MJ, Daly M, Teichmann SA, Rada C. Wu YL, et al. J Exp Med. 2017 Jan;214(1):183-196. doi: 10.1084/jem.20161056. Epub 2016 Dec 19. J Exp Med. 2017. PMID: 27994069 Free PMC article. - AID in Chronic Lymphocytic Leukemia: Induction and Action During Disease Progression.
Oppezzo P, Navarrete M, Chiorazzi N. Oppezzo P, et al. Front Oncol. 2021 May 10;11:634383. doi: 10.3389/fonc.2021.634383. eCollection 2021. Front Oncol. 2021. PMID: 34041018 Free PMC article. Review.
References
- Chaudhuri, J., and F.W. Alt. 2004. Class-switch recombination: interplay of transcription, DNA deamination and DNA repair. Nat. Rev. Immunol. 4:541–552. - PubMed
- Kenter, A.L. 2005. Class switch recombination: an emerging mechanism. Curr. Top. Microbiol. Immunol. 290:171–199. - PubMed
- Longerich, S., U. Basu, F.W. Alt, and U. Storb. 2006. AID in somatic hypermutation and class switch recombination. Curr. Opin. Immunol. 18:164–174. - PubMed
- Stavnezer, J. 1996. Immunoglobulin class switching. Curr. Opin. Immunol. 8:199–205. - PubMed
- Muramatsu, M., K. Kinoshita, S. Fagarasan, S. Yamada, Y. Shinkai, and T. Honjo. 2000. Class switch recombination and hypermutation require activation-induced cytidine deaminase (AID), a potential RNA editing enzyme. Cell. 102:553–563. - PubMed
MeSH terms
Substances
LinkOut - more resources
Full Text Sources
Other Literature Sources
Molecular Biology Databases
Research Materials


