Central and medial amygdaloid brain-derived neurotrophic factor signaling plays a critical role in alcohol-drinking and anxiety-like behaviors - PubMed (original) (raw)
Central and medial amygdaloid brain-derived neurotrophic factor signaling plays a critical role in alcohol-drinking and anxiety-like behaviors
Subhash C Pandey et al. J Neurosci. 2006.
Erratum in
- J Neurosci. 2010 May 26;30(21):7447-8
Abstract
Brain-derived neurotrophic factor (BDNF) is a member of the nerve growth factor family of neurotrophins and plays a vital role in synaptic plasticity. This study investigated the involvement of the amygdaloid BDNF system in molecular mechanisms underlying anxiety and alcohol-drinking behaviors. Male Sprague Dawley rats were cannulated targeting central amygdala (CeA), medial amygdala (MeA), or basolateral amygdala (BLA), and BDNF expression was manipulated using an antisense oligodeoxynucleotide (ODN) strategy. Anxiety-like and alcohol-drinking behaviors were measured after infusion of BDNF sense and antisense ODNs with or without BDNF coinfusion, using the elevated plus-maze test and two-bottle free-choice paradigm, respectively. Here we report that BDNF antisense ODN infusions into the CeA and MeA, but not BLA, provoked anxiety-like behaviors in rats, which were rescued by BDNF coinfusion. The levels of BDNF, p-ERK1/2 (phosphorylated extracellular signal-regulated kinases 1/2), and p-CREB (phosphorylated cAMP responsive-element binding protein) were decreased by BDNF antisense, but not by sense, ODN infusions, which were restored to normal after BDNF coinfusions. Furthermore, BDNF antisense ODN infusions into the CeA or MeA, but not into BLA, increased alcohol intake, which was attenuated by BDNF coinfusions. These novel results suggest that decreased BDNF levels in the CeA and MeA, but not in the BLA, are crucial in regulating alcohol-drinking and anxiety-like behaviors in rats.
Figures
Figure 1.
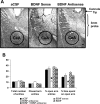
A, Low-magnification view of Nissl staining of the amygdaloid structures of rats. This photomicrograph indicates the position of the cannula, which is just above the targeted area of central amygdala. Scale bar, 200 μm. B, Effect of CeA infusion of aCSF and BDNF sense and antisense ODNs (with and without BDNF coinfusion) on open- and closed-arm activities of the EPM. Total number of entries represents the total numbers of closed- and open-arm entries in EPM. Values are the mean ± SEM of eight rats in each group. Asterisks indicate significant (p < 0.01–0.001) difference from aCSF-infused rats.
Figure 2.
Representative photomicrographs at low magnification showing BDNF (top row), p-CREB (third row), p-ERK1/2 (fourth row), and NeuN (bottom row) gold-immunolabeling and mRNA levels of BDNF (second row) in the CeA brain structures of rats infused with aCSF, BDNF sense, and antisense ODNs (with and without BDNF coinfusion) into the CeA. Scale bar, 30 μm. Insets in the aCSF column indicate immunogold particles within a single cell body or single nucleus at high magnification (100×).
Figure 3.
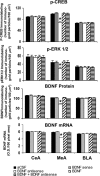
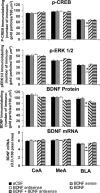
Quantitation of BDNF, p-CREB, and p-ERK1/2 protein levels (number of immunogold particles per 100 μm2 area) and mRNA levels of BDNF in the amygdaloid structures of rats infused with aCSF, BDNF sense, and antisense ODNs (with and without BDNF coinfusion) into the CeA. Values are the mean ± SEM of five to seven rats in each group. The asterisks indicate significant (p < 0.001) difference from aCSF-infused rats.
Figure 4.
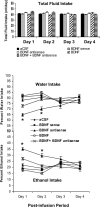
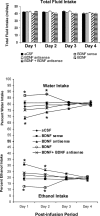
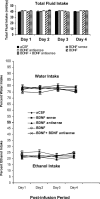
Effect of CeA infusion (once at day 1) of BDNF sense and antisense ODNs and/or BDNF (twice; first infusion at day 1 and second infusion at day 2) on alcohol preference as measured by the two-bottle free-choice paradigm. Results represent the percentage of 7% v/v (ethanol in water solution) ethanol intake and percentage of water intake of total fluid intake (milliliters per day). Values are the mean ± SEM of six rats in each group, and alcohol intake was measured for 4 d in the same group of rats. Asterisks indicate significant (p < 0.001) difference from aCSF-infused rats.
Figure 5.
A, Low-magnification view of Nissl staining of the amygdaloid structures of rats. This photomicrograph indicates the position of the cannula, which is just above the targeted area of medial amygdala. Scale bar, 200 μm. B, Effect of MeA infusion of aCSF and BDNF sense and antisense ODNs (with and without BDNF coinfusion) on open- and closed-arm activities of the elevated plus maze. Total number of entries represents the total numbers of closed- and open-arm entries in EPM. Values are the mean ± SEM of eight to nine rats in each group. Asterisks indicate significant (p < 0.001) difference from aCSF-infused rats.
Figure 6.
Representative photomicrographs at low magnification showing BDNF (top row), p-CREB (third row), p-ERK1/2 (fourth row), and NeuN (bottom row) gold immunolabeling and mRNA levels of BDNF (second row) in the MeA brain structures of rats infused with aCSF, BDNF sense, and antisense ODNs (with and without BDNF coinfusion) into the MeA. Scale bar, 30 μm. Insets in the aCSF column indicate immunogold particles within a single cell body or single nucleus at high magnification (100×).
Figure 7.
Quantitation of BDNF, p-CREB, and p-ERK1/2 protein levels (number of immunogold particles per 100 μm2 area) and mRNA levels of BDNF in the amygdaloid structures of rats infused in the MeA with aCSF and BDNF sense and antisense ODNs (with and without BDNF coinfusion). Values are the mean ± SEM of five to seven rats in each group. Asterisks indicate significant (p < 0.001) difference from aCSF-infused rats.
Figure 8.
Effect of MeA infusion (once at day 1) of BDNF sense and antisense ODNs and/or BDNF (twice; first infusion at day 1 and second infusion at day 2) on alcohol preference as measured by the two-bottle free-choice paradigm. Results represent the percentage of 7% v/v (ethanol in water solution) ethanol intake and percentage of water intake of total fluid intake (milliliters per day). Values are the mean ± SEM of six rats in each group, and alcohol intake was measured for 4 d in the same group of rats. Asterisks indicate significant (p < 0.001) difference from aCSF-infused rats.
Figure 9.
A, Low-magnification view of Nissl staining of amygdaloid structures of rats. This photomicrograph indicates the position of the cannula, which is just above the targeted area of basolateral amygdala. Scale bar, 200 μm. B, Effect of BLA infusion of aCSF and BDNF sense and antisense ODNs (with and without BDNF) on open- and closed-arm activities of the elevated plus maze. Total number of entries represents the total numbers of closed- and open-arm entries in EPM. Values are the mean ± SEM of 6–12 rats in each group.
Figure 10.
Representative photomicrographs at low magnification showing BDNF (top row), p-CREB (third row), p-ERK1/2 (fourth row), and NeuN (bottom row) gold immunolabeling and mRNA levels of BDNF (second row) in the BLA brain structures of rats infused with aCSF and BDNF sense and antisense ODNs (with or without BDNF infusion) into the BLA. Scale bar, 30 μm. Insets in the aCSF column indicate immunogold particles within a single cell body or single nucleus at high magnification (100×).
Figure 11.
Quantitation of BDNF, p-CREB, and p-ERK1/2 protein levels (number of immunogold particles per 100 μm2 area) and mRNA levels of BDNF in the amygdaloid structures of rats infused in the BLA with aCSF and BDNF sense and antisense ODNs (with or without BDNF coinfusion). Values are the mean ± SEM of 6–12 rats in each group. Asterisks indicate significant (p < 0.001) difference from aCSF-infused rats.
Figure 12.
Effect of BLA infusion of BDNF sense and antisense ODNs (once on day 1) with and without BDNF (twice; first infusion on day 1 and second infusion on day 2) on alcohol preference as measured by the two-bottle free-choice paradigm. Results represent the percentage of 7% v/v (ethanol in water solution) ethanol intake and percentage of water intake of total fluid intake (milliliters per day). Values are the mean ± SEM of six to eight rats in each group, and alcohol intake was measured for 4 d in the same group of rats.
Similar articles
- Potential role of adolescent alcohol exposure-induced amygdaloid histone modifications in anxiety and alcohol intake during adulthood.
Pandey SC, Sakharkar AJ, Tang L, Zhang H. Pandey SC, et al. Neurobiol Dis. 2015 Oct;82:607-619. doi: 10.1016/j.nbd.2015.03.019. Epub 2015 Mar 24. Neurobiol Dis. 2015. PMID: 25814047 Free PMC article. - The role of amygdaloid brain-derived neurotrophic factor, activity-regulated cytoskeleton-associated protein and dendritic spines in anxiety and alcoholism.
Moonat S, Sakharkar AJ, Zhang H, Pandey SC. Moonat S, et al. Addict Biol. 2011 Apr;16(2):238-50. doi: 10.1111/j.1369-1600.2010.00275.x. Epub 2010 Dec 23. Addict Biol. 2011. PMID: 21182574 Free PMC article. - Innate differences in the expression of brain-derived neurotrophic factor in the regions within the extended amygdala between alcohol preferring and nonpreferring rats.
Prakash A, Zhang H, Pandey SC. Prakash A, et al. Alcohol Clin Exp Res. 2008 Jun;32(6):909-20. doi: 10.1111/j.1530-0277.2008.00650.x. Epub 2008 Apr 26. Alcohol Clin Exp Res. 2008. PMID: 18445109 - The anxious amygdala: CREB signaling and predisposition to anxiety and alcoholism.
Wand G. Wand G. J Clin Invest. 2005 Oct;115(10):2697-9. doi: 10.1172/JCI26436. J Clin Invest. 2005. PMID: 16200206 Free PMC article. Review. - BDNF mechanisms in late LTP formation: A synthesis and breakdown.
Panja D, Bramham CR. Panja D, et al. Neuropharmacology. 2014 Jan;76 Pt C:664-76. doi: 10.1016/j.neuropharm.2013.06.024. Epub 2013 Jul 2. Neuropharmacology. 2014. PMID: 23831365 Review.
Cited by
- Paradoxical facilitatory effect of low-dose alcohol consumption on memory mediated by NMDA receptors.
Kalev-Zylinska ML, During MJ. Kalev-Zylinska ML, et al. J Neurosci. 2007 Sep 26;27(39):10456-67. doi: 10.1523/JNEUROSCI.2789-07.2007. J Neurosci. 2007. PMID: 17898217 Free PMC article. - Essential Role of Histone Methyltransferase G9a in Rapid Tolerance to the Anxiolytic Effects of Ethanol.
Berkel TDM, Zhang H, Teppen T, Sakharkar AJ, Pandey SC. Berkel TDM, et al. Int J Neuropsychopharmacol. 2019 Apr 1;22(4):292-302. doi: 10.1093/ijnp/pyy102. Int J Neuropsychopharmacol. 2019. PMID: 30590608 Free PMC article. - Formation of aversive memories associated with conditioned drug withdrawal requires BDNF expression in the amygdala in acute morphine-dependent rats.
Ju YY, Long JD, Liu Y, Liu JG. Ju YY, et al. Acta Pharmacol Sin. 2015 Dec;36(12):1437-43. doi: 10.1038/aps.2015.94. Epub 2015 Nov 16. Acta Pharmacol Sin. 2015. PMID: 26567727 Free PMC article. - Role of the amygdala opioid system in the effects of stress on the post-learning sleep patterns of male Wistar rats.
Graily-Afra M, Bahrami F, Bahari Z, Sahraei H, Shankayi Z, Gharib A. Graily-Afra M, et al. Iran J Basic Med Sci. 2025;28(3):283-291. doi: 10.22038/ijbms.2024.79291.17266. Iran J Basic Med Sci. 2025. PMID: 39906619 Free PMC article. - Genetic and pharmacological manipulations of the CB(1) receptor alter ethanol preference and dependence in ethanol preferring and nonpreferring mice.
Vinod KY, Yalamanchili R, Thanos PK, Vadasz C, Cooper TB, Volkow ND, Hungund BL. Vinod KY, et al. Synapse. 2008 Aug;62(8):574-81. doi: 10.1002/syn.20533. Synapse. 2008. PMID: 18509854 Free PMC article.
References
- Agassandian K, Gedney M, Cassell MD (2006). Neurotrophic factors in the central nucleus of amygdala may be organized to provide substrates for associative learning. Brain Res 1076:78–86. - PubMed
- Barnea A, Roberts J (2001). Induction of functional and morphological expression of neuropeptide Y (NPY) in cortical cultures by brain-derived neurotrophic factor (BDNF): evidence for a requirement for extracellular-regulated kinase (ERK)-dependent and ERK-independent mechanisms. Brain Res 919:57–69. - PubMed
- Bibel M, Barde YA (2000). Neurotrophins: key regulators of cell fate and cell shape in the vertebrate nervous system. Genes Dev 14:2919–2937. - PubMed
- Davis M (1997). Neurobiology of fear responses: the role of the amygdala. J Neuropsychiatry Clin Neurosci 9:382–402. - PubMed
Publication types
MeSH terms
Substances
LinkOut - more resources
Full Text Sources
Medical
Miscellaneous
