Quantitative determination of uracil residues in Escherichia coli DNA: Contribution of ung, dug, and dut genes to uracil avoidance - PubMed (original) (raw)
Quantitative determination of uracil residues in Escherichia coli DNA: Contribution of ung, dug, and dut genes to uracil avoidance
Sibghat-Ullah Lari et al. DNA Repair (Amst). 2006.
Abstract
The steady-state levels of uracil residues in DNA extracted from strains of Escherichia coli were measured and the influence of defects in the genes for uracil-DNA glycosylase (ung), double-strand uracil-DNA glycosylase (dug), and dUTP pyrophosphatase (dut) on uracil accumulation was determined. A sensitive method, called the Ung-ARP assay, was developed that utilized E. coli Ung, T4pdg, and the Aldehyde Reactive Probe reagent to label abasic sites resulting from uracil excision with biotin. The limit of detection was one uracil residue per million DNA nucleotides (U/10(6)nt). Uracil levels in the genomic DNA of E. coli JM105 (ung+ dug+) were at the limit of detection, as were those of an isogenic dug mutant, regardless of growth phase. Inactivation of ung in JM105 resulted in 31+/-2.6 U/10(6)nt during early log growth and 19+/-1.7 U/10(6)nt in saturated phase. An ung dug double mutant (CY11) accumulated 33+/-2.9 U/10(6)nt and 23+/-1.8U/10(6)nt during early log and saturated phase growth, respectively. When cultures of CY11 were supplemented with 20 ng/ml of 5-fluoro-2'-deoxyuridine, uracil levels in early log phase growth DNA rose to 125+/-1.7 U/10(6)nt. Deoxyuridine supplementation reduced the amount of uracil in CY11 DNA, but uridine did not. Levels of uracil in DNA extracted from CJ236 (dut-1 ung-1) were determined to be 3000-8000 U/10(6)nt as measured by the Ung-ARP assay, two-dimensional thin-layer chromatography of metabolically-labeled 32P DNA, and LC/MS of uracil and thymine deoxynucleosides. DNA sequencing revealed that the sole molecular defect in the CJ236 dUTP pyrophosphatase gene was a C-->T transition mutation that resulted in a Thr24Ile amino acid change.
Figures
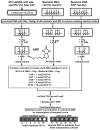
Fig. 1
Scheme for quantitative detection of uracil residues in DNA.
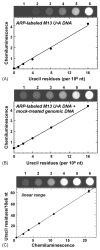
Fig. 2
Standard curve for measuring uracil-DNA. (A) Chemiluminescence (arbitrary units) of M13 U·A DNA samples containing 0, 1, 2, 4, 8, or 16 U/106 nt (lanes 1–6, respectively). Samples without control genomic DNA were prepared in duplicate (only one set of samples is shown) as described under Section 2. Error bars representing the standard deviation are hidden by plot symbols. (B) Chemiluminescence of M13 U·A DNA combined with control genomic DNA. Samples were prepared in duplicate; error bars are hidden by plot symbols. (C) Linear range of the Ung-ARP assay. Chemiluminescence intensity was recorded as a function of increasing amounts (U/106 nt) of uracil-rich DNA from Escherichia coli CJ236.
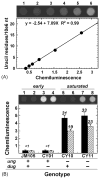
Fig. 3
Uracil accumulation in isogenic E. coli ung dug mutants. (A) Standard curve of Ung-ARP-associated chemiluminescence constructed using JM105 (ung+ dug+) control DNA and M13 U·A DNA as shown in Fig. 2B. A digital image of the dot blot chemiluminescence is shown. Lanes 1–6 correspond to samples containing 0, 1, 2, 4, 8, and 16 U/106 nt, respectively. A graph of the chemiluminescence intensity of the samples is shown below the image. An equation (inset) relates the uracil-DNA concentration (U/106 nt) of the standards as a function of chemiluminescence intensity; _R_2 represents the coefficient of determination. The negative intercept indicates a background chemiluminescence of 0.36 arbitrary units from JM105 DNA. (B) Uracil accumulation in ung dug mutants of JM105. Mutant strains were constructed as described under Section 2 and grown in minimal medium supplemented with Norit-treated casamino acids. Genomic DNA from early (solid bars) and late (striped bars) log phase growth cultures was analyzed for uracil accumulation using the standard curve shown in (A). A digital image of the dot blot chemiluminescence is shown. Samples in lanes 1–4 were respectively purified from JM105, CY01, CY10, and CY11 cultures in early log phase growth; samples in lanes 5–8 were from the respective JM105, CY01, CY10, and CY11 cultures in late log phase growth. Numbers over the bars indicate the amount of uracil residues per million nucleotides. Errors represent the standard deviation of three independent determinations.
Fig. 4
Effect of 5-fluoro-2′-deoxyuridine on uracil accumulation in CY11 genomic DNA. Cultures of CY11 (ung dug) were propagated in the presence of 0, 10, and 20 ng/ml of 5-fluoro-2′-deoxyuridine, harvested at either early log or saturated growth phase as indicated, and the DNA was extracted and subjected to the Ung-ARP assay. An image of the chemiluminescence reaction is shown about the bar graph. The level of uracil residues was determined by means of the uracil-DNA standard curve (image not shown). Numbers above the bars indicate the number of uracil residues per million nucleotides.
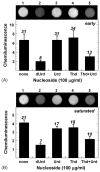
Fig. 5
Effect of nucleoside supplementation on uracil accumulation in CY11 (ung dug) DNA. (A) Early log phase growth; (B) saturated phase growth. DNA from CJ236 cultures supplemented (100 μg/ml) as indicated with either dUrd, Urd, Thd, Thd and Urd, or not at all, was subjected to the Ung-ARP assay. An image of each chemiluminescence reaction is shown about the bar graph. The level of uracil residues was determined by means of a uracil-DNA standard curve (not shown). Numbers above the bars indicate the number of uracil residues per million nucleotides.
Fig. 6
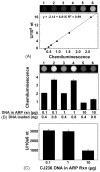
Determination of uracil residues in CJ236 (_dut_-_1 ung_-1) genomic DNA. (A) Uracil-DNA standard curve, constructed as described under Fig. 3. Lanes 1–6 correspond respectively to samples containing 0, 1, 2, 4, 8, and 16 U/106 nt. (B) Chemiluminescence of early log CJ236 DNA. The amount of CJ236 in the Ung-ARP reaction as well as the amount of ARP-labeled DNA applied to the dot blot is listed below each column of the bar graph and corresponds to lanes 1–6 of the chemiluminescence digital image. JM105 control DNA was added to bring the total amount of DNA applied to the dot blot to100 ng. Error bars represent the standard deviation of the chemiluminescence intensity of two determinations. (C) The level of uracil in early log CJ236 DNA was calculated based on the standard curve shown in (A) and the average chemiluminescence intensity of each reaction condition shown in (B).
Fig. 7
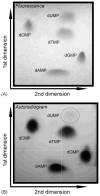
Two-dimensional thin-layer chromatography of CJ236 32P 2′-deoxynucleoside 5′-monophosphates. (A) Fluorescence image of CJ236 2′-deoxynucleoside 5′-monophosphates on a PEI-cellulose sheet subjected to two-dimensional thin-layer chromatography. CJ236 DNA (20 μg) was digested to 5′-dNMPs, filtered, supplemented with 5′-dUMP, and applied to a PEI-cellulose sheet as described under Section 2. (B) 32P autoradiogram of the PEI-cellulose sheet shown in (A).
Fig. 8
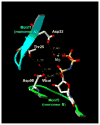
Coordination environment of Thr24 in E. coli dUTP pyrophosphatase. A part of the active site is shown from the crystal structure of E. coli dUTP pyrophosphatase in complex with an α,β-imino-dUTP substrate analogue (adapted from Barabas et al. [63]. The backbone of Motif 1 from monomer A is cyan, and that of Motif 3 from monomer B is green. Side chain and ligand (Mg2+ and α,β-imino-dUTP) are in atomic coloring (O, red, N, blue, P, yellow, C, white). H-bonds are dashed yellow, lengths are given in angstroms. Wcat indicates the catalytic water molecule in-line with the scissile bond. Two other waters are shown: one is coordinated both to Asp90 and Thr25, while the other is within the Mg-sphere (shown for orientation reasons only). Numbering is according to the PDB file reported in Barabas et al. [63] where the protein possessed an additional Met at the N-terminus because of cloning; therefore, Thr25 is Thr24 in the original sequence. (For interpretation of the references to colour in this figure legend, the reader is referred to the web version of the article.)
Similar articles
- Synthesis and metabolism of uracil-containing deoxyribonucleic acid in Escherichia coli.
Warner HR, Duncan BK, Garrett C, Neuhard J. Warner HR, et al. J Bacteriol. 1981 Feb;145(2):687-95. doi: 10.1128/jb.145.2.687-695.1981. J Bacteriol. 1981. PMID: 6109711 Free PMC article. - Fidelity of uracil-initiated base excision DNA repair in Escherichia coli cell extracts.
Sung JS, Bennett SE, Mosbaugh DW. Sung JS, et al. J Biol Chem. 2001 Jan 19;276(3):2276-85. doi: 10.1074/jbc.M008147200. Epub 2000 Oct 16. J Biol Chem. 2001. PMID: 11035036 - Multiple mutant of Escherichia coli synthesizing virtually thymineless DNA during limited growth.
el-Hajj HH, Wang L, Weiss B. el-Hajj HH, et al. J Bacteriol. 1992 Jul;174(13):4450-6. doi: 10.1128/jb.174.13.4450-4456.1992. J Bacteriol. 1992. PMID: 1624437 Free PMC article. - Uracil-initiated base excision DNA repair synthesis fidelity in human colon adenocarcinoma LoVo and Escherichia coli cell extracts.
Sanderson RJ, Bennett SE, Sung JS, Mosbaugh DW. Sanderson RJ, et al. Prog Nucleic Acid Res Mol Biol. 2001;68:165-88. doi: 10.1016/s0079-6603(01)68098-x. Prog Nucleic Acid Res Mol Biol. 2001. PMID: 11554295 Review. - Uracil-DNA glycosylase: Structural, thermodynamic and kinetic aspects of lesion search and recognition.
Zharkov DO, Mechetin GV, Nevinsky GA. Zharkov DO, et al. Mutat Res. 2010 Mar 1;685(1-2):11-20. doi: 10.1016/j.mrfmmm.2009.10.017. Epub 2009 Nov 10. Mutat Res. 2010. PMID: 19909758 Free PMC article. Review.
Cited by
- Detection of Genomic Uracil Patterns.
Békési A, Holub E, Pálinkás HL, Vértessy BG. Békési A, et al. Int J Mol Sci. 2021 Apr 9;22(8):3902. doi: 10.3390/ijms22083902. Int J Mol Sci. 2021. PMID: 33918885 Free PMC article. Review. - Visualization of uracils created by APOBEC3A using UdgX shows colocalization with RPA at stalled replication forks.
Stewart JA, Schauer G, Bhagwat AS. Stewart JA, et al. Nucleic Acids Res. 2020 Nov 18;48(20):e118. doi: 10.1093/nar/gkaa845. Nucleic Acids Res. 2020. PMID: 33074285 Free PMC article. - Genome-wide mapping of regions preferentially targeted by the human DNA-cytosine deaminase APOBEC3A using uracil-DNA pulldown and sequencing.
Sakhtemani R, Senevirathne V, Stewart J, Perera MLW, Pique-Regi R, Lawrence MS, Bhagwat AS. Sakhtemani R, et al. J Biol Chem. 2019 Oct 11;294(41):15037-15051. doi: 10.1074/jbc.RA119.008053. Epub 2019 Aug 19. J Biol Chem. 2019. PMID: 31431505 Free PMC article. - Sequencing abasic sites in DNA at single-nucleotide resolution.
Liu ZJ, Martínez Cuesta S, van Delft P, Balasubramanian S. Liu ZJ, et al. Nat Chem. 2019 Jul;11(7):629-637. doi: 10.1038/s41557-019-0279-9. Epub 2019 Jun 17. Nat Chem. 2019. PMID: 31209299 Free PMC article. - Deoxyuracil in DNA and disease: Genomic signal or managed situation?
Chon J, Field MS, Stover PJ. Chon J, et al. DNA Repair (Amst). 2019 May;77:36-44. doi: 10.1016/j.dnarep.2019.02.014. Epub 2019 Feb 27. DNA Repair (Amst). 2019. PMID: 30875637 Free PMC article. Review.
References
- Mosbaugh DW, Bennett SE. Uracil-excision DNA repair. Prog Nucl Acid Res Mol Biol. 1994;48:315–370. - PubMed
- O’Donovan GA. Thymidine Metabolism in Bacteria. Plenum Publishing; New York: 1977. pp. 219–253.
Publication types
MeSH terms
Substances
Grants and funding
- P30 ES00210/ES/NIEHS NIH HHS/United States
- R01 GM066245-05/GM/NIGMS NIH HHS/United States
- R01 GM066245/GM/NIGMS NIH HHS/United States
- GM66245/GM/NIGMS NIH HHS/United States
- P30 ES000210/ES/NIEHS NIH HHS/United States
LinkOut - more resources
Full Text Sources
Molecular Biology Databases
Research Materials
Miscellaneous
