Satb2 haploinsufficiency phenocopies 2q32-q33 deletions, whereas loss suggests a fundamental role in the coordination of jaw development - PubMed (original) (raw)
Satb2 haploinsufficiency phenocopies 2q32-q33 deletions, whereas loss suggests a fundamental role in the coordination of jaw development
Olga Britanova et al. Am J Hum Genet. 2006 Oct.
Abstract
The recent identification of SATB2 as a candidate gene responsible for the craniofacial dysmorphologies associated with deletions and translocations at 2q32-q33, one of only three regions of the genome for which haploinsufficiency has been significantly associated with isolated cleft palate, led us to investigate the in vivo functions of murine Satb2. We find that, similar to the way in which SATB2 is perceived to act in humans, craniofacial defects due to haploinsufficiency of Satb2, including cleft palate (in approximately 25% of cases), phenocopy those seen with 2q32-q33 deletions and translocations in humans. Full functional loss of Satb2 results in amplification of these defects and leads both to increased apoptosis in the craniofacial mesenchyme where Satb2 is usually expressed and to changes in the pattern of expression of three genes implicated in the regulation of craniofacial development in humans and mice: Pax9, Alx4, and Msx1. The Satb2-dosage sensitivity in craniofacial development is conspicuous--along with its control of cell survival, pattern of expression, and reversible functional modification by SUMOylation, it suggests that Satb2/SATB2 function in craniofacial development may prove to be more profound than has been anticipated previously. Because jaw development is Satb2-dosage sensitive, the regulators of Satb2 expression and posttranslational modification become of critical importance both ontogenetically and evolutionarily, especially since such regulators plausibly play undetected roles in jaw and palate development and in the etiology of craniofacial malformations.
Figures
Figure 1.
Pharyngeal and early-morphogenetic-stage Satb2 expression. a–c, Satb2 expression detected through in situ hybridization at E10.5 and E11.5 in the mesenchyme of the distal maxillary BA1 (mx), associated FNP (l = lateral; m = medial), and the distal mandibular BA1 (md). Expression is associated with the distal regions but, significantly, is excluded from the actual midlines (arrowheads). op = olfactory pit. d, Radioactive in situ hybridization at E12.5, demonstrating Satb2 expression in the tongue (tg) and in the developing lower (md) and upper (mx) jaws, including in the future palatal shelves (ps).
Figure 2.
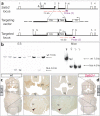
Design rationale for the targeted loss of Satb2. a, Schematic representation of the Satb2 locus, the targeting vector, and the targeted locus. Coding exons are shown as unblackened boxes. Restriction sites are _Sma_I (S), _Nsi_I (N), and _Pac_I (P). Oligonucleotides are indicated by arrows and are designated “a” and “b.” The expected fragments are indicated by the dashed red lines. The 3′ external probe (purple box) identifies a 7.5-kb _Nsi_I fragment in the wild-type allele and a 4.6-kb fragment in the mutant allele. b, Analysis of transfected ES cells (left) and wild-type (WT), heterozygous (+/−), and homozygous (−/−) mice (right) by genomic Southern-blot analysis with a 3′ external probe. Mut = mutant allele. c and d, Immunohistochemical detection of Satb2 protein in E13.5 wild-type (c) and Satb2 −/− (d) embryos. Satb2 immunoreactivity (arrowheads) is detected in the forming palatal shelves (ps) of the wild-type embryo, whereas it is not detected in the craniofacial primordia of the Satb2 −/− embryo; however, possibly because of exon skipping, some Satb2-positive cells are detected in the spinal cord of the Satb2 −/− embryo, just as they are in the wild-type embryo. ns = Nasal septum; sc = spinal cord; tg = tongue.
Figure 3.
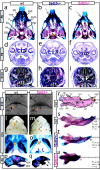
Satb2 gene-dosage sensitivity in craniofacial development. a–c, Differentially stained skulls of wild-type (wt), Satb2 +/−, and Satb2 −/− neonates demonstrating the effect of gene dosage on upper jaw and palatal (yellow arrowheads) development. White arrows indicate hypoplasia of premaxillae (px) and nasal capsules. Green arrowhead (c) indicates the exacerbated deficiencies of nasal capsules, primary palate, and upper incisors (compare with panel b). Red arrows (b and c) indicate the midline trabecular basal plate. as = Alisphenoid; bs = basisphenoid; mx = maxilla; pg = pterygoid; psm = maxillary palatal shelf; psp = palatine palatal shelf; psx = premaxillary palatal shelf; v = vomer. d–i, Comparative histological sections of nissel-stained wild-type, Satb2+/−, and Satb2−/− postnatal day 0 and E13.5 embryos, highlighting loss of parasagittal hard- and soft-tissue structures. Arrowheads: green = midline nasal septum; peach = upper molar tooth or bud; turquoise = lower molar tooth or bud; red = body of Meckel’s cartilage; blue outlined in yellow = midline of lower jaw and tongue; black outlined in green = developing palatal shelf; black outlined in red = tongue; black outlined in yellow = developing submandibular gland; white = nasopharynx. j and k, Scanning electron micrographs of wild-type and Satb2 −/− embryos at E12. Unblackened arrowheads indicate the midline, orange arrowheads highlight relative mandibular hypoplasia, and arrows indicate maxillary and FNP deficits (compare oral aperatures). l and m, Gross anatomy of wild-type and Satb2 −/− E16 littermates demonstrating the small mouth, parasagittal hypoplasia, micrognathia, and maintenance of midline structures in mutants. “a–e” indicate relative positions of lateral and mandibular sinus follicles. Arrows are as in panels j and k. n and o, Skulls of the specimen in panels l and m, showing the specific loss of the distal portion of dentaries and distal juxtaposed portion of Meckel’s cartilage (compare orange arrowheads) but the presence of the midline rostral process (unblackened arrowheads). This maintenance of the midline of lower-jaw apparatus is mirrored in the upper jaws by the presence of the nasal septum and associated paraseptal cartilages and vomeronasal organs but the absence of much of the premaxillae and associated nasal capsule and incisors. p and q, Microcephaly, micrognathia (black arrowhead), premaxillary (px) hypoplasia (arrow), and absence of incisors in a neonatal Satb2 −/− skull seen in norma lateralis (q) compared with a wild-type skull (p). Note the maintenance of the articular region (purple arrowheads). r, Labeled schema of wild-type neonatal dentary indicating the orientation for measuring relative dentary length. agp = Angular process; 2agp = secondary cartilage of agp; cdp = condylar process; 2cdp = secondary cartilage of cdp; crp = coronoid process; dnt = body of the dentary; ina = incisive alveolus; LI = lower incisor; moa = molar alveolus; mtf = mental foramen; rpMC = rostral process of Meckel’s cartilage. s–u, Measurements of neonatal wild-type, Satb2 +/−, and Satb2 −/− littermates along with , SD, and population size (n) of the measured population for which they are samples.
Figure 4.
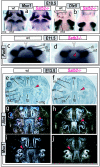
Gene expression in Satb2 −/− mutants. a and b, In situ hybridization of Msx1 (a) and Dlx5 (b) in wild-type (wt) and Satb2 −/− mutant E10.5 embryos indicating the presence of the initial molecular polarity in the developing branchial arches of Satb2 −/− mutants. l = Lateral frontonasal process; m = medial frontonasal process; md = mandibular BA1; mx = maxillary BA1; op = olfactory pit. c and d, Marked decrease of Pax9 expression at E11.5 in the mandibular incisor field (if) of the mutant (red arrowhead) presages the loss of the incisor developmental module. The white arrow indicates the midline. di = Diastema; mf = molar field. e and f, Serial histological sections of wild-type (e, g, and i) and Satb2 −/− mutant (f, h, and j) embryos at E13.5 highlight the nasal capsular hypoplasia, microglossia, and loss of submandibular glands in the mutant and the subregional loss (compare red arrowheads) of Alx4 (h) and Msx1 (j) expression within the base of the developing palate of the mutant. lm = Lower molar bud; MC = Meckel’s cartilage; nc = nasal capsule; ns = nasal septum; oe = olfactory epithelium; ps = palatal shelf; smg = submandibular gland; tg = tongue; um = upper molar bud.
Figure 5.
Increased cell death at E11.5 in Satb2 −/− mutants. Parasagittal (a and b) and coronal (c and d) sections of E11.5 wild-type (a and c) and Satb2 −/− (b and d) embryos assayed for apoptosis (TUNEL) demonstrate focal increases in cell death in the mandibular (md [_red arrowheads_]), maxillary (mx [_yellow arrowheads_]), and frontonasal (fnp [_yellow arrowheads_]) mesenchyme. White arrowheads indicate the midline, green arrowheads indicate the lambdoidal junction, and purple arrowheads point to typical apoptosis found at the maxillo-mandibular junction. fb = Forebrain; hrt = heart; hy = hyoid arch; op = olfactory pit.
Figure 6.
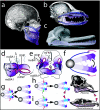
Modeling the significance of Satb2 for coordination and elaboration of jaw development. a and b, Hemisected human (a) and canine (b) skulls showing the nature of jaws as hinged, appositional mechanisms of which polarity and potential modularity are characteristics. The translucent circle around the jaw articulation represents the hinge as a region, whereas the blue arrows highlight the polarity generated by the position of the hinge. The potential for modularity inherent in polarized structures is depicted by the relative purple shading of the jaws. c, Functional demands, such as for the matched occlusion of the homodont dentition of the jaws of the Ganges River dolphin (Platanista gangetica), dictate that jaw registration must be ontogenetically coordinated. The lower jaw is lavender to better differentiate the jaws. d and e, Diagrams of E10.5 murine embryos, highlighting the integration of some of the signaling centers believed to act in setting pattern, polarity, and modularity in the developing jaw primordia. The translucent circle represents the presumptive hinge region, whereas the blue arrows indicate positional information, such as Fgf expression, emanating from the first pharyngeal plate and the oral ectoderm at the junction of the maxillary (mxBA1) and mandibular (mdBA1) first arch in this region. This positional information is integrated with midline signaling sources coming from the distal midline mdBA1 and the lambdoidal junction (λ), where mxBA1 meets the medial (mFNP) and lateral (lFNP) frontonasal processes. The relative purple shading signifies the polarity and potential modularity of the primorida set up by this integration. The orange arrowhead indicates the mdBA1 midline, whereas the blue discs indicate the relative positions of Satb2 expression in the left-side upper- and lower-jaw primordia. Modified from Depew et al. f, Diagram integrating pattern, polarity, and modularity between embryonic and adult jaws. The disc represents the articulation of the upper and lower jaws, whereas the arrows represent the integrated signaling from the hinge region (blue) and distal ends (red). Polarity and modularity are marked by the toothed modules differentially shaded in purple. g–i, Three (of many) hypothetical scenarios for the modification of jaw modules through the differential regulation of Satb2 activity. Although it is assumed that the default state lies with the equivalence of each complementary module, the functional demands of any particular organism may require the modification of one or more complementary modules. This can occur by altering Satb2 activity at multiple levels, including both transcriptionally and posttranscriptionally. g, Scenario one: simultaneous down-regulation (red bars) of Satb2 activity in the blue modules of both the upper and lower jaws may result in either the diminution of growth of these modules (top arrow) or the loss of these modules (bottom arrow), a scenario essentially examined in our targeted loss of Satb2. h, Scenario two: specific down-regulation (red bars) of Satb2 activity in the upper-jaw blue module, its up-regulation (green arrow) in the lower jaw, or both may result in relative lengthening of the lower jaw, such as seen in the mastodon, Phiomia. Modified from Romer after Andrews. i, Scenario three: specific up-regulation (green arrow) of Satb2 activity in the upper-jaw blue module, its down-regulation (red bars) in the lower jaw, or both may result in relative lengthening of the upper jaw, such as seen in the thecodont, Chasmatosaurus. Modified from Romer.
Similar articles
- Identification of SATB2 as the cleft palate gene on 2q32-q33.
FitzPatrick DR, Carr IM, McLaren L, Leek JP, Wightman P, Williamson K, Gautier P, McGill N, Hayward C, Firth H, Markham AF, Fantes JA, Bonthron DT. FitzPatrick DR, et al. Hum Mol Genet. 2003 Oct 1;12(19):2491-501. doi: 10.1093/hmg/ddg248. Epub 2003 Jul 29. Hum Mol Genet. 2003. PMID: 12915443 - Effects of phenytoin on Satb2 and Hoxa2 gene expressions in mouse embryonic craniofacial tissue.
Mao XY, Tang SJ. Mao XY, et al. Biochem Cell Biol. 2010 Aug;88(4):731-5. doi: 10.1139/O10-013. Biochem Cell Biol. 2010. PMID: 20651846 - Further supporting evidence for the SATB2-associated syndrome found through whole exome sequencing.
Zarate YA, Perry H, Ben-Omran T, Sellars EA, Stein Q, Almureikhi M, Simmons K, Klein O, Fish J, Feingold M, Douglas J, Kruer MC, Si Y, Mao R, McKnight D, Gibellini F, Retterer K, Slavotinek A. Zarate YA, et al. Am J Med Genet A. 2015 May;167A(5):1026-32. doi: 10.1002/ajmg.a.36849. Am J Med Genet A. 2015. PMID: 25885067 - Progress of epigenetic modification of SATB2 gene in the pathogenesis of non-syndromic cleft lip and palate.
Ma Y, Liu H, Shi L. Ma Y, et al. Asian J Surg. 2024 Jan;47(1):72-76. doi: 10.1016/j.asjsur.2023.09.113. Epub 2023 Oct 16. Asian J Surg. 2024. PMID: 37852859 Review. - SATB2-associated syndrome: Mechanisms, phenotype, and practical recommendations.
Zarate YA, Fish JL. Zarate YA, et al. Am J Med Genet A. 2017 Feb;173(2):327-337. doi: 10.1002/ajmg.a.38022. Epub 2016 Oct 24. Am J Med Genet A. 2017. PMID: 27774744 Free PMC article. Review.
Cited by
- Special AT-rich sequence-binding protein 2 (Satb2) synergizes with Bmp9 and is essential for osteo/odontogenic differentiation of mouse incisor mesenchymal stem cells.
Chen Q, Zheng L, Zhang Y, Huang X, Wang F, Li S, Yang Z, Liang F, Hu J, Jiang Y, Li Y, Zhou P, Luo W, Zhang H. Chen Q, et al. Cell Prolif. 2021 Apr;54(4):e13016. doi: 10.1111/cpr.13016. Epub 2021 Mar 4. Cell Prolif. 2021. PMID: 33660290 Free PMC article. - Cryopreservation process alters the expression of genes involved in pathways associated with the fertility of bull spermatozoa.
Ebenezer Samuel King JP, Sinha MK, Kumaresan A, Nag P, Das Gupta M, Arul Prakash M, Talluri TR, Datta TK. Ebenezer Samuel King JP, et al. Front Genet. 2022 Oct 25;13:1025004. doi: 10.3389/fgene.2022.1025004. eCollection 2022. Front Genet. 2022. PMID: 36386822 Free PMC article. - Bmp and Shh signaling mediate the expression of satb2 in the pharyngeal arches.
Sheehan-Rooney K, Swartz ME, Lovely CB, Dixon MJ, Eberhart JK. Sheehan-Rooney K, et al. PLoS One. 2013;8(3):e59533. doi: 10.1371/journal.pone.0059533. Epub 2013 Mar 21. PLoS One. 2013. PMID: 23555697 Free PMC article. - Current knowledge of tooth development: patterning and mineralization of the murine dentition.
Catón J, Tucker AS. Catón J, et al. J Anat. 2009 Apr;214(4):502-15. doi: 10.1111/j.1469-7580.2008.01014.x. J Anat. 2009. PMID: 19422427 Free PMC article. Review. - Osteoblast-specific transcription factor Osterix (Osx) is an upstream regulator of Satb2 during bone formation.
Tang W, Li Y, Osimiri L, Zhang C. Tang W, et al. J Biol Chem. 2011 Sep 23;286(38):32995-3002. doi: 10.1074/jbc.M111.244236. Epub 2011 Aug 2. J Biol Chem. 2011. PMID: 21828043 Free PMC article.
References
Web Resource
- Online Mendelian Inheritance in Man (OMIM), http://www.ncbi.nlm.nih.gov/Omim/ (for CPI, MSX1, PAS9, TBX1, SATB2, Alx4, Dlx5, Pitx1, Prx2, Barx1, dHand, and Hoxa2)
References
- Depew MJ, Tucker AS, Sharpe PT (2002) Craniofacial development. In: Rossant J, Tam PPL (eds) Mouse development: patterning, morphogenesis, and organogenesis. Academic Press, San Diego, pp 421–498
Publication types
MeSH terms
Substances
LinkOut - more resources
Full Text Sources
Medical
Molecular Biology Databases


