Adenosine A2A receptor activation reduces hepatic ischemia reperfusion injury by inhibiting CD1d-dependent NKT cell activation - PubMed (original) (raw)
Adenosine A2A receptor activation reduces hepatic ischemia reperfusion injury by inhibiting CD1d-dependent NKT cell activation
Courtney M Lappas et al. J Exp Med. 2006.
Abstract
Ischemia reperfusion injury results from tissue damage during ischemia and ongoing inflammation and injury during reperfusion. Liver reperfusion injury is reduced by lymphocyte depletion or activation of adenosine A2A receptors (A2ARs) with the selective agonist 4-{3-[6-amino-9-(5-ethylcarbamoyl-3,4-dihydroxy-tetrahydro-furan-2-yl)-9H-purin-2-yl]- prop-2-ynyl}-cyclohexanecarboxylic acid methyl ester (ATL146e). We show that NKT cells are stimulated to produce interferon (IFN)-gamma by 2 h after the initiation of reperfusion, and the use of antibodies to deplete NK1.1-positive cells (NK and NKT) or to block CD1d-mediated glycolipid presentation to NKT cells replicates, but is not additive to, the protection afforded by ATL146e, as assessed by serum alanine aminotransferase elevation, histological necrosis, neutrophil accumulation, and serum IFN-gamma elevation. Reduced reperfusion injury observed in RAG-1 knockout (KO) mice is restored to the wild-type (WT) level by adoptive transfer of NKT cells purified from WT or A2AR KO mice but not IFN-gamma KO mice. Additionally, animals with transferred A2AR-/- NKT cells are not protected from hepatic reperfusion injury by ATL146e. In vitro, ATL146e potently inhibits both anti-CD3 and alpha-galactosylceramide-triggered production of IFN-gamma by NKT cells. These findings suggest that hepatic reperfusion injury is initiated by the CD1d-dependent activation of NKT cells, and the activation of these cells is inhibited by A2AR activation.
Figures
Figure 1.
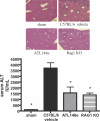
Protection from hepatic IRI by A2AR activation or lymphocyte deficiency. WT or Rag-1 KO C57BL/6 mice were subjected to 72 min of hepatic ischemia followed by 24 h of reperfusion, or sham surgeries. Immediately after the initiation of reperfusion, animals received ATL146e or vehicle control. Animals were killed by cervical dislocation after 24 h of reperfusion, blood was collected via retro-orbital bleed, and serum ALT was measured. Additionally, livers were perfused, and left liver lobes were collected and placed immediately into 4% paraformaldehyde. Necrosis was measured via H &E staining. Data shown are from three independent experiments (n = 9); error bars indicate SEM. *, P < 0.01 versus C57BL/6 vehicle control as assessed by one-way ANOVA, followed by Dunnett's multiple comparison test. H &E staining shown is representative of five 10× fields of view photographed for each of nine animals in three independent experiments. Bar, 200 μm.
Figure 2.
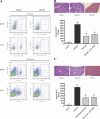
Involvement of NKT cells in the pathogenesis of hepatic IRI. WT C57BL/6 mice were subjected to hepatic IRI or sham surgeries. Immediately after the initiation of reperfusion, select animals received ATL146e or vehicle control. Additionally, animals received either a single i.p. injection of 200 μg PK136 or vehicle control 2 d before surgery (A and B) or a single i.p. injection of 300 μg of a CD1d blocking antibody or vehicle control 24 h before surgery (C). Animals were killed by cervical dislocation after 24 h of reperfusion, blood was collected via retro-orbital bleed, and serum ALT was measured. Livers were perfused, and left liver lobes were collected and placed immediately into 4% paraformaldehyde. Necrosis was measured via H &E staining. Cell depletion by PK136 was assessed via the FACS analysis of spleen and liver tissue harvested from PK136-treated mice after 24 h of reperfusion (A). Numbers indicate the percentages of CD3+CD1d tetramer+ (A, top) and CD45+DX5+ (A, bottom) cells in the boxed regions. Data shown are from three independent experiments (n = 9); error bars indicate SEM. *, P < 0.01 versus vehicle control as assessed by one-way ANOVA, followed by Dunnett's multiple comparison test. H &E staining shown is representative of five 10× fields of view photographed for each of nine animals in three independent experiments. Bar, 200 μm.
Figure 3.
Adoptive transfer of NKT cells restores injury to RAG-1 KO mice. WT or RAG-1 KO C57BL/6 mice were subjected to 72 min of hepatic IRI or sham surgeries. Immediately after the initiation of reperfusion, select animals received ATL146e or vehicle control. Purified CD4+NK1.1+ T cells from WT (A and B), IFN-γ KO (C), or A2AR KO (D) C57BL/6 mice were adoptively transferred into select RAG-1 KO mice 4 d before hepatic IRI. Successful reconstitution of CD4+NK1.1+ T cells into the livers of recipient animals was confirmed by FACS analysis of leukocytes collected from liver tissue after 24 h of reperfusion; numbers indicate the percentages of cells in each quadrant (B). Animals were killed by cervical dislocation after 24 h of reperfusion, blood was collected via retro-orbital bleed, and serum ALT was measured. Data shown are from three independent experiments (n = 9); error bars indicate SEM. *, P < 0.01 versus WT C57BL/6 control as assessed by one-way ANOVA, followed by Dunnett's multiple comparison test.
Figure 4.
Effect of NKT cell depletion or blockade on downstream events in reperfusion injury. WT or Rag-1 KO C57BL/6 mice were subjected to 72 min of partial hepatic ischemia and 2 or 24 h of reperfusion. Select animals received an i.p. injection of 200 μg PK136 2 d before surgery, an i.p. injection of 300 μg CD1d blocking antibody 24 h before surgery, or ATL146e immediately after the initiation of reperfusion. (A) Intracellular IFN-γ production by CD3+/CD4+/CD1d-tetramer labeled NKT cells collected from postischemic tissue was assessed by FACS. Data shown are from three independent experiments (n = 9); error bars indicate SEM. *, P < 0.05 versus vehicle control as assessed by one-way ANOVA, followed by Dunnett's multiple comparison test. (B) Blood was collected by retro-orbital bleed 24 h after the initiation of reperfusion, and serum IFN-γ levels were measured by ELISA. Data shown are from three independent experiments (n = 9); error bars indicate SEM. *, P < 0.01 versus vehicle control as assessed by one-way ANOVA, followed by Dunnett's multiple comparison test. (C) Mice were killed by cervical dislocation 24 h after the initiation of reperfusion, livers were perfused, and the left liver lobes were collected and placed immediately into 4% paraformaldehyde fixative. Immunostaining of neutrophils was performed with rat anti–mouse neutrophil primary antibody. Data shown are from a single experiment representative of three independent experiments (n = 9). Bar, 200 μm.
Figure 5.
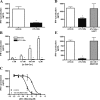
Inhibition by ATL146e of IFN-γ production by activated NKT cells. (A) Purified NKT cells (200,000 per well) were incubated on immobilized anti-CD3 mAb in the presence of vehicle or 100 nM ATL146e. Supernatants were collected after 24 h, and IFN-γ concentrations were measured by ELISA. Data are shown as the mean ± SEM from three independent experiments performed in triplicate. *, P < 0.01 versus vehicle control as assessed by an unpaired t test. (B) Bulk splenocytes (300,000 cells per well) were incubated with 1 U/ml ADA and 1 nM-1 μM α-Gal-Cer in the presence of 100 nM ATL146e or vehicle. *, P < 0.01 versus corresponding vehicle control as assessed by an unpaired t test. (C) Bulk splenocytes (300,000 cells per well) were incubated with 1 U/ml ADA and 1 μM α-Gal-Cer in the presence or absence of varying concentrations of ATL146e ± 100 nM ZM241385 or vehicle. (D) Bulk splenocytes (300,000 cells per well) were incubated with 1 U/ml ADA and 1 μM α-Gal-Cer in the presence or absence of 1 nM ATL146e ± 1 μM 8-SPT or vehicle. (E) Purified CD4+NK1.1+ T cells (150,000 cells per well) were incubated with lymphocyte- and NK cell–deficient splenocytes (300,000 cells per well), 1 U/ml ADA, and 1 μM α-Gal-Cer in the presence or absence of 100 nM ATL146e ± 100 nM ZM241385. NK1.1-expressing cells were depleted from RAG-1 KO splenocytes via a FACSVantage SE Turbo Sorter. Supernatants were collected after 48 h, and IFN-γ concentrations were determined by ELISA. Data shown are from a single experiment performed in triplicate, representative of three independent experiments. *, P < 0.01 versus vehicle control as assessed by one-way ANOVA, followed by Dunnett's multiple comparison test (D and E); error bars indicate SEM (A–E).
Figure 6.
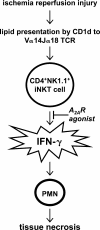
Hypothetical scheme of reperfusion-induced inflammatory injury in the liver. Reperfusion results in the generation of ROS and H2O2, and also in the CD1d-dependent activation of NKT cells. NKT cells are activated to produce IFN-γ early after the initiation of reperfusion, and this activation is inhibited by A2AR activation. As a consequence of this inhibition, downstream events in the reperfusion-induced inflammatory cascade (including neutrophil accumulation and tissue necrosis) are considerably reduced by ATL146e treatment.
Similar articles
- Protection from ischemic liver injury by activation of A2A adenosine receptors during reperfusion: inhibition of chemokine induction.
Day YJ, Marshall MA, Huang L, McDuffie MJ, Okusa MD, Linden J. Day YJ, et al. Am J Physiol Gastrointest Liver Physiol. 2004 Feb;286(2):G285-93. doi: 10.1152/ajpgi.00348.2003. Am J Physiol Gastrointest Liver Physiol. 2004. PMID: 14715520 - A2A adenosine receptors on bone marrow-derived cells protect liver from ischemia-reperfusion injury.
Day YJ, Li Y, Rieger JM, Ramos SI, Okusa MD, Linden J. Day YJ, et al. J Immunol. 2005 Apr 15;174(8):5040-6. doi: 10.4049/jimmunol.174.8.5040. J Immunol. 2005. PMID: 15814735 - Preactivation of NKT cells with alpha-GalCer protects against hepatic ischemia-reperfusion injury in mouse by a mechanism involving IL-13 and adenosine A2A receptor.
Cao Z, Yuan Y, Jeyabalan G, Du Q, Tsung A, Geller DA, Billiar TR. Cao Z, et al. Am J Physiol Gastrointest Liver Physiol. 2009 Aug;297(2):G249-58. doi: 10.1152/ajpgi.00041.2009. Epub 2009 Jun 25. Am J Physiol Gastrointest Liver Physiol. 2009. PMID: 19556359 Free PMC article. - Development and function of CD1d-restricted NKT cells: influence of sphingolipids, SAP and sex.
Sandberg JK, Ljunggren HG. Sandberg JK, et al. Trends Immunol. 2005 Jul;26(7):347-9. doi: 10.1016/j.it.2005.05.006. Trends Immunol. 2005. PMID: 15925541 Review. - Gene expression in NKT cells: defining a functionally distinct CD1d-restricted T cell subset.
Wilson SB, Byrne MC. Wilson SB, et al. Curr Opin Immunol. 2001 Oct;13(5):555-61. doi: 10.1016/s0952-7915(00)00258-2. Curr Opin Immunol. 2001. PMID: 11544003 Review.
Cited by
- Inflammatory targets of therapy in sickle cell disease.
Owusu-Ansah A, Ihunnah CA, Walker AL, Ofori-Acquah SF. Owusu-Ansah A, et al. Transl Res. 2016 Jan;167(1):281-97. doi: 10.1016/j.trsl.2015.07.001. Epub 2015 Jul 11. Transl Res. 2016. PMID: 26226206 Free PMC article. Review. - Molecular mechanisms of liver ischemia reperfusion injury: insights from transgenic knockout models.
Datta G, Fuller BJ, Davidson BR. Datta G, et al. World J Gastroenterol. 2013 Mar 21;19(11):1683-98. doi: 10.3748/wjg.v19.i11.1683. World J Gastroenterol. 2013. PMID: 23555157 Free PMC article. Review. - Adora2b adenosine receptor signaling protects during acute kidney injury via inhibition of neutrophil-dependent TNF-α release.
Grenz A, Kim JH, Bauerle JD, Tak E, Eltzschig HK, Clambey ET. Grenz A, et al. J Immunol. 2012 Nov 1;189(9):4566-73. doi: 10.4049/jimmunol.1201651. Epub 2012 Oct 1. J Immunol. 2012. PMID: 23028059 Free PMC article. Retracted. - Co-receptor choice by V alpha14i NKT cells is driven by Th-POK expression rather than avoidance of CD8-mediated negative selection.
Engel I, Hammond K, Sullivan BA, He X, Taniuchi I, Kappes D, Kronenberg M. Engel I, et al. J Exp Med. 2010 May 10;207(5):1015-29. doi: 10.1084/jem.20090557. Epub 2010 Apr 19. J Exp Med. 2010. PMID: 20404101 Free PMC article. - The Impact of Invariant NKT Cells in Sterile Inflammation: The Possible Contribution of the Alarmin/Cytokine IL-33.
Ferhat MH, Robin A, Barbier L, Thierry A, Gombert JM, Barbarin A, Herbelin A. Ferhat MH, et al. Front Immunol. 2018 Oct 15;9:2308. doi: 10.3389/fimmu.2018.02308. eCollection 2018. Front Immunol. 2018. PMID: 30374349 Free PMC article. Review.
References
- Day, Y.J., M.A. Marshall, L. Huang, M.J. McDuffie, M.D. Okusa, and J. Linden. 2004. Protection from ischemic liver injury by activation of A2A adenosine receptors during reperfusion: inhibition of chemokine induction. Am. J. Physiol. Gastrointest. Liver Physiol. 286:G285–G293. - PubMed
- Cronstein, B.N. 1994. Adenosine, an endogenous anti-inflammatory agent. J. Appl. Physiol. 76:5–13. - PubMed
- Lappas, C.M., J.M. Rieger, and J. Linden. 2005. A2A adenosine receptor induction inhibits IFN-gamma production in murine CD4+ T cells. J. Immunol. 174:1073–1080. - PubMed
- Linden, J. 2001. Molecular approach to adenosine receptors: receptor- mediated mechanisms of tissue protection. Annu. Rev. Pharmacol. Toxicol. 41:775–787. - PubMed
- Ohta, A., and M. Sitkovsky. 2001. Role of G-protein-coupled adenosine receptors in downregulation of inflammation and protection from tissue damage. Nature. 414:916–920. - PubMed
Publication types
MeSH terms
Substances
LinkOut - more resources
Full Text Sources
Other Literature Sources
Molecular Biology Databases
Research Materials


