Notch1 is a p53 target gene involved in human keratinocyte tumor suppression through negative regulation of ROCK1/2 and MRCKalpha kinases - PubMed (original) (raw)
. 2007 Mar 1;21(5):562-77.
doi: 10.1101/gad.1484707.
Anna Mandinova, Paola Ostano, Vihren Kolev, Valerie Calpini, Ingrid Kolfschoten, Vikram Devgan, Jocelyn Lieb, Wassim Raffoul, Daniel Hohl, Victor Neel, Jonathan Garlick, Giovanna Chiorino, G Paolo Dotto
Affiliations
- PMID: 17344417
- PMCID: PMC1820898
- DOI: 10.1101/gad.1484707
Notch1 is a p53 target gene involved in human keratinocyte tumor suppression through negative regulation of ROCK1/2 and MRCKalpha kinases
Karine Lefort et al. Genes Dev. 2007.
Abstract
Little is known about the regulation and function of the Notch1 gene in negative control of human tumors. Here we show that Notch1 gene expression and activity are substantially down-modulated in keratinocyte cancer cell lines and tumors, with expression of this gene being under p53 control in these cells. Genetic suppression of Notch signaling in primary human keratinocytes is sufficient, together with activated ras, to cause aggressive squamous cell carcinoma formation. Similar tumor-promoting effects are also caused by in vivo treatment of mice, grafted with keratinocytes expressing oncogenic ras alone, with a pharmacological inhibitor of endogenous Notch signaling. These effects are linked with a lesser commitment of keratinocytes to differentiation, an expansion of stem cell populations, and a mechanism involving up-regulation of ROCK1/2 and MRCKalpha kinases, two key effectors of small Rho GTPases previously implicated in neoplastic progression. Thus, the Notch1 gene is a p53 target with a role in human tumor suppression through negative regulation of Rho effectors.
Figures
Figure 1.
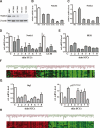
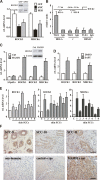
Notch 1 expression and activity are down-modulated in keratinocyte SCC cell lines and tumors in parallel with p53 activity. (A) Primary human keratinocytes (HKC) were analyzed in parallel with keratinocyte-derived SCC cell lines (SCC011, SCC012, SCC13, and SCC022) by immunoblotting for Notch1 and β-actin proteins. (B,C) The same set of cells as in A and the SCC09 cell line were analyzed for levels of Notch1 (B) and Notch2 (C) mRNA by real-time RT–PCR. Values are in relative arbitrary units after β-actin normalization. (D) Total RNA from surgically excised skin SCCs were analyzed in parallel with a set of three normal human epidermis controls (C) for Notch1 mRNA expression by real-time RT–PCR. Three other SCC samples obtained by LCM were similarly analyzed along with similarly obtained surrounding normal epidermis that was used as a reference control. The results are expressed as fold changes of expression of Notch1 mRNA levels in the tumors versus normal epidermis (after β-actin normalization). (E) The same samples from surgically excised skin SCCs and epidermis controls were analyzed for HES1 mRNA expression by real-time RT–PCR with the corresponding specific primers and β-actin normalization. (F) Comparative analysis of genes with aberrant expression in skin SCCs versus Notch-responsive genes. A dendrogram obtained from agglomerative hierarchical clustering applied to a 105 × 10 gene per sample matrix using average link as linkage method and cosine correlation as metric. Genes modulated by activated Notch1 in primary human keratinocytes were previously identified by microarray analysis of adenovirally infected cells (using an Affymetrix HG-U133Av2 platform) (Nguyen et al. 2006). The red and green name list refers to genes that are up- and down-regulated, respectively, by activated Notch1 (positive fold change and absolute Z-score higher than 1.96). The matrix columns refer to the eight SCC samples analyzed by RT–PCR above, plus two additional ones, whose gene expression was compared with the average expression of three normal epidermal tissues using the same platform (Affymetrix HG-U133Av2). As an overall measure of the general variation in gene expression among the normal control samples, for each gene with intensity p value <0.01, the intensity standard deviation was divided by the intensity mean to obtain the gene coefficient of variation. Then the mean coefficient of variation (MCV) was used to measure the variability among normal samples. The MCV was equal to 0.6 if all genes or just the notch-responsive ones were considered, whereas it was equal to 0.7 if only the p53-responsive genes (as identified in _H_) were taken into consideration. A red-to-green gradient was used to indicate, for each gene, levels of up- or down-regulation in the individual tumors relative to normal controls. The corresponding gene symbols are indicated. The comprehensive log-ratio values of the matrix used for hierarchical clustering are provided as Supplementary Table 1. (_G_) The same samples from surgically excised skin SCCs and epidermis controls were analyzed for Btg2 and p21WAF1/Cip1 mRNA expression by real-time RT–PCR with the corresponding specific primers and β-actin normalization. (_H_) Dendrogram obtained from agglomerative hierarchical clustering applied to a 111 × 10 gene per sample matrix using average link as linkage method and cosine correlation as metric. Genes modulated by knockdown of p53 by transfection of primary human keratinocytes with corresponding specific siRNA versus control oligonucleotides (at 3 d after transfection) were identified by microarray analysis with the Affymetrix (HG-U133AAv2) platform. The red and green name list refers to genes that were up- and down-regulated, respectively, by siRNA for p53 (_p_ value <0.01 and absolute fold change >2). The matrix columns refer to the cluster analysis of the same SCC samples and normal epidermis examined in A–H. A red-to-green gradient was used to indicate, for each gene, levels of up- or down-regulation in the individual tumors relative to normal controls. The corresponding gene symbols are indicated. The comprehensive log-ratio values of the matrix used for hierarchical clustering is provided as Supplementary Table 2.
Figure 2.
Expression of the Notch1 gene is under positive p53 control in normal and SCC-derived keratinocytes. (A) Primary human keratinocytes were treated with Nutlin (10 μM) or DMSO vehicle control for 24 h, or transfected with siRNAs for p53 or scrambled siRNAs control for 48 h. Induction and suppression of endogenous p53, respectively, were verified by immunoblotting. Notch1 expression was also assessed by immunoblotting as well as real-time RT–PCR, using β-actin for internal normalization. (B) Primary human keratinocytes (HKC), alongside the squamous (SCC13, SCC028) and colon (HCT116) carcinoma cell lines, were infected with a recombinant adenovirus expressing wild-type p53 (Ad-p53) or GFP control (Ad-GFP) for 24 h, followed by determination of Notch1 mRNA levels by real-time RT–PCR as before. For each pair of cells, expression values are expressed relative to those of the Ad-GFP-infected controls. (C) HCT116 colon carcinoma cells were treated with Nutlin (10 μM) or DMSO vehicle control for 24 h, or transfected with siRNAs for p53 or scrambled siRNAs control for 48 h. Induction and suppression of endogenous p53, respectively, were verified by immunoblotting. Notch1 expression was assessed by real-time RT–PCR using β-actin for internal normalization as in A and B. (D) Primary human keratinocytes under growing conditions were processed for ChIP with antibodies specific for p53 or nonimmune IgG control followed by PCR amplification (50 cycles) of various regions of the Notch1 promoter as indicated in the schematic above. The sequences of the two predicted p53-binding sites (p53-A and p53-B) are, respectively, 5′-GGCCACGCCAAGCCATGGTCC-3′ and 5′-AATCACGGCCAGGGATGTCTG-3′. “C” corresponds to an unrelated intervening sequence. Unprecipitated chromatin preparations were similarly analyzed and used as “input DNA” control. (E) Binding of endogenous p53 to its two predicted sites in the Notch1 promoter was quantified by ChIP assay and real-time PCR in human keratinocytes versus HCT116 colon carcinoma cells. The amount of precipitated DNA was calculated relative to the total input chromatin, and expressed as a percentage of the total according to the following formula (Frank et al. 2001): percentage total = 2ΔCt × 5, where ΔCt = Ct (input) − Ct (immunoprecipitation), and Ct is the cycle threshold.
Figure 3.
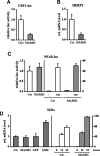
Expression of MAM51 in human primary keratinocytes inhibits specifically Notch/CBF-1-dependent transcription. (A) Primary human keratinocytes infected with a retrovirus expressing the MAM51 peptide or empty vector control (Ctr) were transfected with a luciferase reporter for Notch–CBF1 activity (CBF1-Luc; 1 μg) together with a Renilla minimal reporter for internal normalization (0.05 μg). Promoter activity was measured 48 h after transfection. (B) MAM51-expressing and control keratinocytes were examined for levels of endogenous HERP1 expression by real-time RT–PCR analysis. Values are expressed as arbitrary units after normalization for GAPDH expression. (C, left panel) MAM51-expressing and control keratinocytes were transfected with a luciferase reporter for NF-κB activity (1 μg) together with a Renilla minimal reporter for internal normalization (0.05 μg). (Right panel) The same cells were transfected with a luciferase reporter for NF-κB activity plus/minus an expression vector for a H-rasV12 oncogene (1 μg). Promoter activity was measured 48 h after transfection. (D, left panel) Levels of endogenous IκBα expression, a direct target of NF-κB activation, were determined by real-time RT–PCR analysis of MAM51-expressing and control keratinocytes in parallel with primary human keratinocytes infected with an activated Notch1-expressing adenovirus (hNIC) or GFP control. Levels of endogenous IκBα expression were similarly determined in MAM51-expressing and control keratinocytes under basal conditions and after induction of differentiation by suspension culture for the indicated times (in hours).
Figure 4.
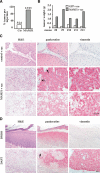
Inhibition of Notch signaling in human keratinocytes promotes tumor formation. (A) Incidence of tumor formation by primary human keratinocytes expressing the MAM51 peptide plus oncogenic ras (MAM51) or control cells expressing oncogenic ras alone (Ctr). Human primary keratinocytes at passage 3 were infected with a MAM51- and GFP-expressing retrovirus (Weng et al. 2003) or an empty vector expressing only GFP. The efficiency of infection was >90%. After two more passages, MAM51-expressing and control keratinocytes were infected with an H-rasV12 transducing retrovirus (LZRS-rasV12) (Lazarov et al. 2002) and, 16 h after infection, cells were admixed with Matrigel and injected subcutaneously in the suprascapular regions of NOD/SCID mice. To minimize individual animal variations, the same mice were injected in parallel with MAM51-expressing and control keratinocytes. The percentage and total number of tumors/injection at 6 wk after injection are indicated. No tumor formation was detected by similar assays with MAM51-expressing and control keratinocytes without oncogenic ras expression (data not shown). (B) Weight of the pairs of individual tumors formed by _ras_-expressing MAM51 and control keratinocytes after parallel injections in the same mice. Shown are only the cases where control cells gave rise to detectable tumors. (C) Histological and immunohistochemical analysis of tumors formed by control keratinocytes expressing oncogenic ras alone and keratinocytes expressing MAM51 together with oncogenic ras. For the latter tumors, shown are the widespread areas with morphological features of spindle cell (middle panels) and clear cell carcinoma formation (bottom panels). Tissues were processed for H&E staining and immunohistochemical analysis with antibodies against pankeratins and vimentin as indicated. The anti-vimentin antibodies are human specific and do not cross-react with mouse tissue. In the middle panel are visible areas of local invasion, indicated by arrows. Bar, 90 μm. (D) Histological and immunohistochemical analysis of grafts formed by human primary keratinocytes expressing oncogenic H-rasV12 alone, injected subcutaneously into nude mice that were subsequently treated three times per week with either DMSO or DAPT (1 mM) as indicated. Mice were sacrificed 4 wk after injections, and graft tissues were processed for H&E staining and immunostaining as above. In the bottom panels are visible areas of local invasion, indicated by arrows. Bar, 90 μm.
Figure 5.
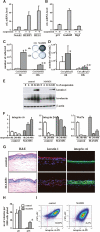
MAM51 expression in primary human keratinocytes suppresses commitment to differentiation and enhances stem cell populations. (A) Primary human keratinocytes were either kept under growing attached conditions or cultured in suspension on polyHEME-coated petri dishes, as previously described (Di Cunto et al. 1998), for 12–48 h. Cells were analyzed by real-time RT–PCR for Notch1, HERP1, and HES1 mRNA levels. There was a progressive increase of expression of these genes from the 12- to 48-h time point of suspension culture shown here. (B) The same samples as in A were analyzed for p21, Gadd45α, and Btg2 RNA levels by real-time RT–PCR. Even in this case, there was a progressive increase of expression of these genes from 12 to 48 h of suspension culture. (C) MAM51-expressing and control keratinocytes were cultured in suspension for either 6 or 12 h, followed by replating them (3 × 10⁵ cells/3.5-cm dish) and culturing for additional 5 d. Shown are the stained dishes with the corresponding cell density. The statistical significance of the differences at 6 and 12 h was calculated by _T_-test; (*) p = 0.003; (**) p = 0.002. (D) Primary human keratinocytes infected with a short hairpin RNA (shRNA) retroviral vector for p53 (pRS-p53) or an empty vector control (Ctrl) (Brummelkamp et al. 2002) were cultured in suspension for either 6 or 12 h, followed by replating them and culturing for an additional 5 d as in C. The statistical significance of the differences at 6 and 12 h was calculated by _T_-test; (*) p = 0.09; (**) p = 0.07. (E) MAM51-expressing and control keratinocytes were kept under growing conditions or induced to differentiate by suspension culture for the indicated times (in hours). Total protein extracts were analyzed by immunoblotting for keratin 1, involucrin, and β-actin as equal loading controls. (F) MAM51-expressing and control keratinocytes under growing conditions or induced to differentiate by suspension culture for 24 or 48 h were analyzed for integrins α6 and β4 and Wnt7a mRNA levels by real-time RT–PCR. Values are expressed as arbitrary units after normalization for β-actin expression. Down-modulation of these genes by increased Notch signaling was confirmed by parallel experiments with primary human keratinocytes infected with adenoviruses expressing activated Notch 1 versus GFP control (data not shown). (G) Tridimensional organotypic cultures formed by MAM51-expressing (bottom panels) or control (top panels) keratinocytes grown on fibroblast-embedded dermal equivalents submerged in media for 4 d and for 10 d at the air–liquid interface were analyzed by H&E staining and immunofluorescence for keratin 1 and integrin α6. (H) MAM51-expressing and control cultures were examined for number of keratinocytes with clonogenic potential by a NIH3T3 feeder assay. Keratinocytes were infected with the MAM51-expressing retrovirus and empty vector control at passage 3. Cells at passages 6 (p6) and 16 (p16) were plated under sparse conditions (103/10-cm dish) on triplicate dishes in the presence of mitomycin C-treated NIH3T3-J2 fibroblasts, and the number of macroscopic colonies was determined by rhodamine staining at 2 wk after plating. _T_-test calculations indicated that only the differences at passage 16 were statistically significant; (*) p = 0.004. (I) MAM51-expressing and control keratinocyte cultures (passage 16) were examined for the population of cells with elevated integrin α6 and low CD71 expression, by FACS analysis. Shown are two-color fluorescence dot plots of control- (left panel) and MAM51-expressing (right panel) keratinocytes labeled simultaneously for integrin α6-PE and CD71-APC. The percentage of α6briCD71dim obtained for each is indicated.
Figure 6.
The ROCK1/2 and MRCKα kinase genes are negative Notch targets up-regulated in experimental and clinically occurring SCC. (A) Primary human keratinocytes were infected with adenoviruses expressing activated Notch 1 (hNIC), HES1, or GFP control for 24 h and analyzed for levels of ROCK2 and MRCKα expression by real-time RT–PCR. Values are expressed in arbitrary units after normalization for β-actin expression. (Insert) Levels of ROCK2 protein expression by immunoblotting with the corresponding antibody and for β-actin as an equal loading control. (B) Primary human keratinocytes were processed for ChIP with an antibody against the HES1-associated Tle1 protein and purified rabbit IgGs as a nonimmune control. Real-time RT–PCR of two distinct regions of the ROCK2 gene containing, respectively, a high- and low-affinity HES1-binding site (HES-A and HES-B; see map above) were performed along with PCR of an HES1-binding site-free region, which was used as negative control (C). The results were normalized for “input” levels of unprecipitated chromatin DNA and expressed as arbitrary units. The nucleotide sequences of the predicted HES1-binding sites (at the indicated nucleotide positions relative to the translation initiation codon) are CACCAG for HES-A, and CAAGTG for HES-B. The HES-A site fully matches the sequence of the high-affinity HES1-binding sites (N-boxes), while the HES-B site matches the sequence of the low-affinity HES1-binding sites (class B sites) (Iso et al. 2003). (C) MAM51-expressing and control keratinocytes (Ctrl) at passage 5 were analyzed for levels of ROCK1, ROCK2, and MRCKα expression, in parallel with ΔN-p63α, by real-time RT–PCR as in B. (Insert) Levels of ROCK2 protein expression by immunoblotting with the corresponding antibody and for β-actin as equal loading control. (D) Primary human keratinocytes treated with DMSO or DAPT (10 μM) for 24 h were analyzed for levels of ROCK1, ROCK2, and MRCKα expression by real-time RT–PCR as in C. (E) The same samples from surgically excised skin SCCs and epidermis controls examined in Figure 1, D, E, and G were analyzed for mRNA expression of ROCK1, ROCK2, and MRCKα by real-time RT–PCR with the corresponding specific primers, using primers for either the human 36B4 gene (Quan et al. 2002) or β-actin for normalization. (F) Three additional clinically occurring skin SCCs were analyzed for ROCK2 expression by immunohistochemistry with corresponding antibodies (top panels) in parallel with a similar analysis of tumors formed in NOD/SCID mice by primary human keratinocytes expressing H-rasV12 alone (control + ras) or together with MAM51 (MAM51 + ras) (bottom panels). A nonimmune negative control is also shown. Bar, 90 μm.
Figure 7.
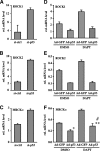
The ROCK1/2 and MRCKα kinase genes are negative p53 targets. (A–C) Primary human keratinocytes were transfected with p53-specific siRNAs or siRNA controls and analyzed, at 48 h after transfection, for levels of ROCK1 (A), ROCK2 (B), and MRCKα (C) by real-time RT–PCR with β-actin for normalization. (D–F) Primary human keratinocytes were infected with an adenovirus expressing wild-type p53 (Ad-p53) or a GFP control (Ad-GFP) for 2 h followed by treatment with DMSO or DAPT (10 μM) for an additional 24 h. Cells were analyzed for levels of ROCK1 (D), ROCK2 (E), and MRCKα (F) mRNA expression by real-time RT–PCR as in A–C. In F, the statistical significance of the differences between Ad-GFP- and Ad-p53-infected cells with either DMSO or DAPT treatment was calculated by _T_-test; (*) p = 0.002; (**) p = 0.001. _T_-test analysis was also used to evaluate the difference in MRCKα levels after Ad-p53 infection in DMSO- versus DAPT-treated cells; (#) p = 0.03.
Figure 8.
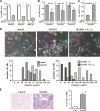
Increased ROCK1/2 and MRCKα expression accounts for altered commitment to differentiation and increased motility of keratinocytes with suppressed Notch signaling. (A) Primary human keratinocytes were transfected with siRNAs (200 nM each) for the ROCK1, ROCK2, and MRCKα genes (S1, S2, Sα), alongside siRNA controls (C), followed 72 h later by determination of their expression levels by real-time RT–PCR. Values are in arbitrary units after normalization for β-actin expression. (B) MAM51-expressing keratinocytes were transfected with siRNAs for ROCK1/2 and MRCKα genes (S1,2,α) followed 72 h later by determination of integrin α6, β4, and Wnt7a expression by real-time RT–PCR. The statistical significance of the differences was calculated by _T_-test; integrin α6, (*) p = 0.003; integrin β4, (*) p = 0.04; Wnt7a, (*) p = 0.06. (C) MAM51-expressing keratinocytes were transfected with siRNAs as in previous experiments and induced to differentiate by suspension culture for the last 48 h of the experiment. Keratin 1 expression was determined by real-time RT–PCR and expressed in arbitrary units after β-actin normalization; (*) p = 0.002. (D, top panel) The motility of control and MAM51-expressing keratinocytes was measured by time-lapse microscopy over an 8-h period, with tracing of multiple individual cells. Motility was quantified by tracing the movement of 10 individual cells for each of three independent fields per condition, calculating for each cell the velocity of movement (in micrometers per hour). (Bottom panel, left) The number distribution of cells with different motility is indicated. A similar analysis was performed with MAM51-expressing keratinocytes transfected with siRNAs for the ROCK1/2 and MRCKα genes (S1,2,α) versus an siRNA control. (Bottom panel, right) Motility was quantified as before. (E) Control and MAM51-expressing keratinocytes were tested for their capability to migrate through a membrane filter barrier as specified in Materials and Methods. Briefly, cells in medium with low serum concentrations were added to the upper compartment of a Matrigel Invasion Chamber Kit, with the lower compartment containing medium with higher serum concentrations, as chemoattractant. (Left panel) After 24 h of incubation, nonmigratory cells were removed from the upper surface of the filter, and cells that had passed to the lower surface were fixed and stained. (Right panel) Assay quantification was achieved by post-labeling of cells that had crossed the filter with a fluorescent dye, and determining fluorescence intensity values. The assay was done in triplicate, with the indicated standard deviation. The statistical significance of the differences was calculated by _T_-test; (*) p = 0.002. Similar results were obtained in a second independent experiment.
Figure 9.
Increased ROCK1/2 and MRCKα expression accounts for altered commitment to differentiation and tumorigenicity of keratinocytes with suppressed Notch signaling. (A) _H-rasV12_- and MAM51-expressing keratinocytes were injected subcutaneously into NOD/SCID or nude mice or grafted onto nude mice as indicated, followed by treatment every 3 d with either combined siRNAs for ROCK1/2 and MRCKα genes (S1,2,α) or siRNA controls. Mice were sacrificed 4 wk later, and tissue samples were processed for H&E analysis. Bar, 90 μm. (B,C) A second independent experiment with a larger cohort of NOD/SCID mice (eight per group) was injected with _H-rasV12_- and MAM51-expressing keratinocytes followed by treatment with either combined siRNAs for ROCK1/2 and MRCKα genes (S1,2,α) or siRNA controls as above. (B) Tumor size was determined by the use of a caliper at the indicated days after injection, starting from the time the tumors became macroscopically measurable. (C) At the end of the experiment (1 mo after injection), mice were sacrificed, and tumors were carefully separated from surrounding tissue for weight determination. Shown is the average weight of tumors formed in mice treated with control versus specific siRNAs, together with standard deviation and statistical significance as determined by _T_-test; (*) p = 0.007.
Similar articles
- Survivin Modulates Squamous Cell Carcinoma-Derived Stem-Like Cell Proliferation, Viability and Tumor Formation in Vivo.
Lotti R, Palazzo E, Petrachi T, Dallaglio K, Saltari A, Truzzi F, Quadri M, Puviani M, Maiorana A, Marconi A, Pincelli C. Lotti R, et al. Int J Mol Sci. 2016 Jan 12;17(1):89. doi: 10.3390/ijms17010089. Int J Mol Sci. 2016. PMID: 26771605 Free PMC article. - CYFIP1 is directly controlled by NOTCH1 and down-regulated in cutaneous squamous cell carcinoma.
Dziunycz PJ, Neu J, Lefort K, Djerbi N, Freiberger SN, Iotzova-Weiss G, French LE, Dotto GP, Hofbauer GF. Dziunycz PJ, et al. PLoS One. 2017 Apr 14;12(4):e0173000. doi: 10.1371/journal.pone.0173000. eCollection 2017. PLoS One. 2017. PMID: 28410392 Free PMC article. - DeltaNp63alpha repression of the Notch1 gene supports the proliferative capacity of normal human keratinocytes and cervical cancer cells.
Yugawa T, Narisawa-Saito M, Yoshimatsu Y, Haga K, Ohno S, Egawa N, Fujita M, Kiyono T. Yugawa T, et al. Cancer Res. 2010 May 15;70(10):4034-44. doi: 10.1158/0008-5472.CAN-09-4063. Epub 2010 May 4. Cancer Res. 2010. PMID: 20442293 - Oncogene activation and tumor suppressor gene inactivation during multistage mouse skin carcinogenesis.
Bowden GT, Schneider B, Domann R, Kulesz-Martin M. Bowden GT, et al. Cancer Res. 1994 Apr 1;54(7 Suppl):1882s-1885s. Cancer Res. 1994. PMID: 8137304 Review. - Notch tumor suppressor function.
Dotto GP. Dotto GP. Oncogene. 2008 Sep 1;27(38):5115-23. doi: 10.1038/onc.2008.225. Oncogene. 2008. PMID: 18758480 Free PMC article. Review.
Cited by
- Notch receptor inhibition reveals the importance of cyclin D1 and Wnt signaling in invasive esophageal squamous cell carcinoma.
Naganuma S, Whelan KA, Natsuizaka M, Kagawa S, Kinugasa H, Chang S, Subramanian H, Rhoades B, Ohashi S, Itoh H, Herlyn M, Diehl JA, Gimotty PA, Klein-Szanto AJ, Nakagawa H. Naganuma S, et al. Am J Cancer Res. 2012;2(4):459-75. Epub 2012 Jun 28. Am J Cancer Res. 2012. PMID: 22860235 Free PMC article. - p53 Modulates Notch Signaling in MCF-7 Breast Cancer Cells by Associating With the Notch Transcriptional Complex Via MAML1.
Yun J, Espinoza I, Pannuti A, Romero D, Martinez L, Caskey M, Stanculescu A, Bocchetta M, Rizzo P, Band V, Band H, Kim HM, Park SK, Kang KW, Avantaggiati ML, Gomez CR, Golde T, Osborne B, Miele L. Yun J, et al. J Cell Physiol. 2015 Dec;230(12):3115-27. doi: 10.1002/jcp.25052. J Cell Physiol. 2015. PMID: 26033683 Free PMC article. - Transduction of mechanical and cytoskeletal cues by YAP and TAZ.
Halder G, Dupont S, Piccolo S. Halder G, et al. Nat Rev Mol Cell Biol. 2012 Sep;13(9):591-600. doi: 10.1038/nrm3416. Epub 2012 Aug 16. Nat Rev Mol Cell Biol. 2012. PMID: 22895435 - Cutaneous β-human papillomavirus E6 proteins bind Mastermind-like coactivators and repress Notch signaling.
Tan MJ, White EA, Sowa ME, Harper JW, Aster JC, Howley PM. Tan MJ, et al. Proc Natl Acad Sci U S A. 2012 Jun 5;109(23):E1473-80. doi: 10.1073/pnas.1205991109. Epub 2012 Apr 30. Proc Natl Acad Sci U S A. 2012. PMID: 22547818 Free PMC article. - ZNF185 is a p53 target gene following DNA damage.
Smirnov A, Cappello A, Lena AM, Anemona L, Mauriello A, Di Daniele N, Annicchiarico-Petruzzelli M, Melino G, Candi E. Smirnov A, et al. Aging (Albany NY). 2018 Nov 16;10(11):3308-3326. doi: 10.18632/aging.101639. Aging (Albany NY). 2018. PMID: 30446632 Free PMC article.
References
- Andriani F., Margulis A., Lin N., Griffey S., Garlick J.A., Margulis A., Lin N., Griffey S., Garlick J.A., Lin N., Griffey S., Garlick J.A., Griffey S., Garlick J.A., Garlick J.A. Analysis of microenvironmental factors contributing to basement membrane assembly and normalized epidermal phenotype. J. Invest. Dermatol. 2003;120:923–931. - PubMed
- Artavanis-Tsakonas S., Rand M.D., Lake R.J., Rand M.D., Lake R.J., Lake R.J. Notch signaling: Cell fate control and signal integration in development. Science. 1999;284:770–776. - PubMed
- Ayyanan A., Civenni G., Ciarloni L., Morel C., Mueller N., Lefort K., Mandinova A., Raffoul W., Fiche M., Dotto G.P., Civenni G., Ciarloni L., Morel C., Mueller N., Lefort K., Mandinova A., Raffoul W., Fiche M., Dotto G.P., Ciarloni L., Morel C., Mueller N., Lefort K., Mandinova A., Raffoul W., Fiche M., Dotto G.P., Morel C., Mueller N., Lefort K., Mandinova A., Raffoul W., Fiche M., Dotto G.P., Mueller N., Lefort K., Mandinova A., Raffoul W., Fiche M., Dotto G.P., Lefort K., Mandinova A., Raffoul W., Fiche M., Dotto G.P., Mandinova A., Raffoul W., Fiche M., Dotto G.P., Raffoul W., Fiche M., Dotto G.P., Fiche M., Dotto G.P., Dotto G.P., et al. Increased Wnt signaling triggers oncogenic conversion of human breast epithelial cells by a Notch-dependent mechanism. Proc. Natl. Acad. Sci. 2006;103:3799–3804. - PMC - PubMed
- Backvall H., Stromberg S., Gustafsson A., Asplund A., Sivertsson A., Lundeberg J., Ponten F., Stromberg S., Gustafsson A., Asplund A., Sivertsson A., Lundeberg J., Ponten F., Gustafsson A., Asplund A., Sivertsson A., Lundeberg J., Ponten F., Asplund A., Sivertsson A., Lundeberg J., Ponten F., Sivertsson A., Lundeberg J., Ponten F., Lundeberg J., Ponten F., Ponten F. Mutation spectra of epidermal p53 clones adjacent to basal cell carcinoma and squamous cell carcinoma. Exp. Dermatol. 2004;13:643–650. - PubMed
Publication types
MeSH terms
Substances
Grants and funding
- AR39190/AR/NIAMS NIH HHS/United States
- CA16038/CA/NCI NIH HHS/United States
- R01 CA073796/CA/NCI NIH HHS/United States
- R01 AR039190/AR/NIAMS NIH HHS/United States
- P01 CA016038/CA/NCI NIH HHS/United States
- CA73796/CA/NCI NIH HHS/United States
LinkOut - more resources
Full Text Sources
Other Literature Sources
Molecular Biology Databases
Research Materials
Miscellaneous
