NFATc3 mediates chronic hypoxia-induced pulmonary arterial remodeling with alpha-actin up-regulation - PubMed (original) (raw)
NFATc3 mediates chronic hypoxia-induced pulmonary arterial remodeling with alpha-actin up-regulation
Sergio de Frutos et al. J Biol Chem. 2007.
Abstract
Physiological responses to chronic hypoxia include polycythemia, pulmonary arterial remodeling, and vasoconstriction. Chronic hypoxia causes pulmonary arterial hypertension leading to right ventricular hypertrophy and heart failure. During pulmonary hypertension, pulmonary arteries exhibit increased expression of smooth muscle-alpha-actin and -myosin heavy chain. NFATc3 (nuclear factor of activated T cells isoform c3), which is aCa(2+)-dependent transcription factor, has been recently linked to smooth muscle phenotypic maintenance through the regulation of the expression of alpha-actin. The aim of this study was to determine if: (a) NFATc3 is expressed in murine pulmonary arteries, (b) hypoxia induces NFAT activation, (c) NFATc3 mediates the up-regulation of alpha-actin during chronic hypoxia, and (d) NFATc3 is involved in chronic hypoxia-induced pulmonary vascular remodeling. NFATc3 transcript and protein were found in pulmonary arteries. NFAT-luciferase reporter mice were exposed to normoxia (630 torr) or hypoxia (380 torr) for 2, 7, or 21 days. Exposure to hypoxia elicited a significant increase in luciferase activity and pulmonary arterial smooth muscle nuclear NFATc3 localization, demonstrating NFAT activation. Hypoxia induced up-regulation of alpha-actin and was prevented by the calcineurin/NFAT inhibitor, cyclosporin A (25 mg/kg/day s.c.). In addition, NFATc3 knock-out mice did not showed increased alpha-actin levels and arterial wall thickness after hypoxia. These results strongly suggest that NFATc3 plays a role in the chronic hypoxia-induced vascular changes that underlie pulmonary hypertension.
Figures
Fig. 1
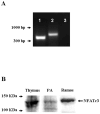
NFATc3 is expressed in mouse pulmonary arteries. A. RT-PCR analysis of NFATc3 expression in isolated intrapulmonary arteries from 9xNFAT-luc mice. Lane 1 shows amplification of NFATc3. Amplification of cyclophilin (control) from pulmonary arteries is shown in lane 2. Lane 3 corresponds to a control without the reverse transcription step. The experiment was repeated at least three times and the same bands were detected in pulmonary arteries from all the mouse strains used in this study. B. Western analysis of NFATc3 protein expression in thymus (C57Bl6), pulmonary arteries (9xNFAT-luc), and human Burkitt’s lymphoma-derived Ramos cells (Santa Cruz). Thymus and Ramos cells were used as positive control.
Fig. 2
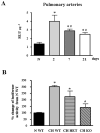
NFAT is activated by CH in pulmonary arteries. A. Pulmonary arteries were isolated from 9xNFAT-luc mice exposed to normoxia (N), or to 2, 7 or 21 days of CH. RLU. μg−1= luciferase activity normalized by μg of total protein. *p<0.05 vs. N; #p<0.05 vs. 2 days, n=5 animals. B. Pulmonary arteries were isolated from 9xNFAT-luc/NFATc3 WT, HET and KO mice exposed to 2 days of CH. Luciferase activity was normalized by μg of total protein and expressed as percent change from N WT (average=1.36±0.19). *p<0.01 vs. N WT, #p<0.05 vs. CH WT and HET, n=4–8 animals.
Fig. 3
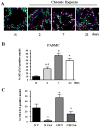
NFATc3 nuclear accumulation increases in pulmonary arterial smooth muscle cells after CH. A. Representative images showing cytosolic localization of NFATc3 under normoxic (N) conditions and nuclear localization following exposure to CH for 2, 7, or 21 days. Lung sections from 9xNFAT-luc mice were co-stained with the DNA-binding dye SYTOX (green), anti-NFATc3 (red) and anti-SM-α-actin (blue). Pulmonary arterial smooth muscle nuclear co-localization of NFATc3 is shown in white. Arrows indicate examples of NFATc3 positive nuclei. B. Summary of effects of CH on NFATc3 nuclear accumulation over time. *p<0.05 vs. N, #p<0.05 vs. 7 and 21 days, n=14 images from at least 3 animals/group (4 arteries/animal). C. Summary of effects of CsA on CH-induced NFATc3 nuclear accumulation. C57B6 mice were treated with vehicle (V) or CsA (25mg/Kg/day) and exposed to N or 7 days of CH. Lung sections were stained as in A. *p<0.05 vs. N V, #p<0.05 vs. CH V, n= 6 images from at least 3 animals/group (2 arteries/animal).
Fig. 4
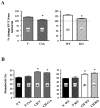
Calcineurin/NFATc3 mediates CH-induced RV hypertrophy but not polycythemia. A. Percent change in RV/T in vehicle (V)- and CsA-treated and WT and KO mice exposed to 7 and 21 days of CH, respectively, normalized to normoxia (N) values. *p<0.01 vs. V or WT. n= see columns. B. Hematocrit (%) in vehicle (V)- and CsA-treated and WT and KO mice exposed to 7 and 21 days of CH, respectively, normalized to normoxia (N) values. *p<0.01 vs. N, n= see columns.
Fig. 5
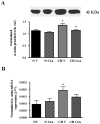
Calcineurin/NFAT mediates CH-induced up-regulation of SM-α-actin in pulmonary arteries. A. Western blot analysis of SM-α-actin protein expression in isolated pulmonary arteries from C57B6 mice treated with vehicle (V) or CsA and exposed to normoxia (N) or CH for 7 days. SM-α-actin band densities were normalized to total protein loaded per lane as determined by Coomasie blue or Sypro Red II staining of the membrane. AU= arbitrary units. *p<0.05 vs. N V, #p<0.05 vs. CH V, n=6 animals, B. Summary of qRT-PCR analysis of SM-α-actin transcript expression in isolated pulmonary arteries from the same animals described in A. Threshold crossing value (CT) was calculated using well factor background subtraction, and gene expression normalized to 18S for each sample. *p<0.05 vs. N V, n=5 animals.
Fig. 6
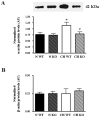
NFATc3 mediates CH-induced up-regulation of SM-α-actin in pulmonary arteries. A. Western blot analysis of SM-α-actin protein expression in isolated pulmonary arteries from WT and NFATc3 KO mice exposed to normoxia (N) or CH for 21 days. SM-α-actin band densities were normalized to total protein loaded per lane as determined by Coomasie blue or Sypro Red II staining of the membrane. AU= arbitrary units. *p<0.05 vs. N WT, #p<0.05 vs. CH WT, n=4 animals. B. Western blot analysis of β-actin protein expression in isolated pulmonary arteries from the same animals described in A. Band densities were normalized to total protein loaded per lane as determined by Sypro Red II staining of the membrane. n=4 animals.
Fig. 7
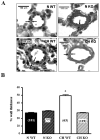
NFATc3 mediates CH-induced increases in pulmonary arterial wall thickness. A. Representative cross sections from normoxic (N) and CH (21 days) WT and KO mice. Arrows point internal and external elastic laminae. B. Percent arterial wall thickness of arteries with diameter of 231–310 μm. *p<0.001. Arteries n= see columns, number of mice 3–4.
Similar articles
- NFATc3 is required for intermittent hypoxia-induced hypertension.
de Frutos S, Duling L, Alò D, Berry T, Jackson-Weaver O, Walker M, Kanagy N, González Bosc L. de Frutos S, et al. Am J Physiol Heart Circ Physiol. 2008 May;294(5):H2382-90. doi: 10.1152/ajpheart.00132.2008. Epub 2008 Mar 21. Am J Physiol Heart Circ Physiol. 2008. PMID: 18359899 Free PMC article. - Endothelin-1 contributes to increased NFATc3 activation by chronic hypoxia in pulmonary arteries.
de Frutos S, Diaz JM, Nitta CH, Sherpa ML, Bosc LV. de Frutos S, et al. Am J Physiol Cell Physiol. 2011 Aug;301(2):C441-50. doi: 10.1152/ajpcell.00029.2011. Epub 2011 Apr 27. Am J Physiol Cell Physiol. 2011. PMID: 21525433 Free PMC article. - NFATc3 is required for chronic hypoxia-induced pulmonary hypertension in adult and neonatal mice.
Bierer R, Nitta CH, Friedman J, Codianni S, de Frutos S, Dominguez-Bautista JA, Howard TA, Resta TC, Bosc LV. Bierer R, et al. Am J Physiol Lung Cell Mol Physiol. 2011 Dec;301(6):L872-80. doi: 10.1152/ajplung.00405.2010. Epub 2011 Sep 9. Am J Physiol Lung Cell Mol Physiol. 2011. PMID: 21908592 Free PMC article. - NFATc3 contributes to intermittent hypoxia-induced arterial remodeling in mice.
de Frutos S, Caldwell E, Nitta CH, Kanagy NL, Wang J, Wang W, Walker MK, Gonzalez Bosc LV. de Frutos S, et al. Am J Physiol Heart Circ Physiol. 2010 Aug;299(2):H356-63. doi: 10.1152/ajpheart.00341.2010. Epub 2010 May 21. Am J Physiol Heart Circ Physiol. 2010. PMID: 20495147 Free PMC article. - Smooth muscle acid-sensing ion channel 1: pathophysiological implication in hypoxic pulmonary hypertension.
Jernigan NL. Jernigan NL. Exp Physiol. 2015 Feb 1;100(2):111-20. doi: 10.1113/expphysiol.2014.081612. Epub 2015 Jan 14. Exp Physiol. 2015. PMID: 25398716 Review.
Cited by
- The Intersection of HIV and Pulmonary Vascular Health: From HIV Evolution to Vascular Cell Types to Disease Mechanisms.
Garcia AK, Almodovar S. Garcia AK, et al. J Vasc Dis. 2024 Jun;3(2):174-200. doi: 10.3390/jvd3020015. Epub 2024 May 6. J Vasc Dis. 2024. PMID: 39464800 Free PMC article. - Regulator of calcineurin 1 (Rcan1) has a protective role in brain ischemia/reperfusion injury.
Sobrado M, Ramirez BG, Neria F, Lizasoain I, Arbones ML, Minami T, Redondo JM, Moro MA, Cano E. Sobrado M, et al. J Neuroinflammation. 2012 Mar 7;9:48. doi: 10.1186/1742-2094-9-48. J Neuroinflammation. 2012. PMID: 22397398 Free PMC article. - Antenatal hypoxia and pulmonary vascular function and remodeling.
Papamatheakis DG, Blood AB, Kim JH, Wilson SM. Papamatheakis DG, et al. Curr Vasc Pharmacol. 2013 Sep;11(5):616-40. doi: 10.2174/1570161111311050006. Curr Vasc Pharmacol. 2013. PMID: 24063380 Free PMC article. Review. - NFATc3 is required for intermittent hypoxia-induced hypertension.
de Frutos S, Duling L, Alò D, Berry T, Jackson-Weaver O, Walker M, Kanagy N, González Bosc L. de Frutos S, et al. Am J Physiol Heart Circ Physiol. 2008 May;294(5):H2382-90. doi: 10.1152/ajpheart.00132.2008. Epub 2008 Mar 21. Am J Physiol Heart Circ Physiol. 2008. PMID: 18359899 Free PMC article. - The protective effects of PCPA against monocrotaline-induced pulmonary arterial hypertension are mediated through the downregulation of NFAT-1 and NF-κB.
Bai Y, Li ZX, Wang HL, Lian GC, Wang Y. Bai Y, et al. Int J Mol Med. 2017 Jul;40(1):155-163. doi: 10.3892/ijmm.2017.3001. Epub 2017 May 26. Int J Mol Med. 2017. PMID: 28560440 Free PMC article.
References
- Rabinovitch M, Gamble W, Nadas AS, Miettinen OS, Reid L. Am J Physiol Heart Circ Physiol. 1979;236:H818–H827. - PubMed
- Weir EK, Archer SL. FASEB J. 1995;9:183–189. - PubMed
- Li KX, Fouty B, McMurtry IF, Rodman DM. Am J Physiol Heart Circ Physiol. 1999;277:H363–H370. - PubMed
- Yuan JXJ, Aldinger AM, Juhaszova M, Wang J, Conte JV, Jr, Gaine SP, Orens JB, Rubin LJ. Circulation. 1998;98:1400–1406. - PubMed
Publication types
MeSH terms
Substances
LinkOut - more resources
Full Text Sources
Molecular Biology Databases
Miscellaneous
