The outer plate in vertebrate kinetochores is a flexible network with multiple microtubule interactions - PubMed (original) (raw)
The outer plate in vertebrate kinetochores is a flexible network with multiple microtubule interactions
Yimin Dong et al. Nat Cell Biol. 2007 May.
Abstract
Intricate interactions between kinetochores and microtubules are essential for the proper distribution of chromosomes during mitosis. A crucial long-standing question is how vertebrate kinetochores generate chromosome motion while maintaining attachments to the dynamic plus ends of the multiple kinetochore MTs (kMTs) in a kinetochore fibre. Here, we demonstrate that individual kMTs in PtK(1) cells are attached to the kinetochore outer plate by several fibres that either embed the microtubule plus-end tips in a radial mesh, or extend out from the outer plate to bind microtubule walls. The extended fibres also interact with the walls of nearby microtubules that are not part of the kinetochore fibre. These structural data, in combination with other recent reports, support a network model of kMT attachment wherein the fibrous network in the unbound outer plate, including the Hec1-Ndc80 complex, dissociates and rearranges to form kMT attachments.
Figures
Figure 1
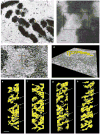
Electron tomography reveals that the unbound kinetochore outer plate is a fibrous network. (a) Lower magnification image of a nocodazole-treated mitotic PtK1 cell prepared by high-pressure freezing and freeze-substitution (see Methods). Red arrowheads indicate kinetochores visible in the 200-nm thick plastic section. The blue arrow indicates the kinetochore shown in b–d. (b) A higher magnification image reveals the fine structure of the kinetochore indicated by the blue arrow in a. The kinetochore outer plate appears as a fibrous mat with a thickness of 50–75 nm. (c) A 1.6-nm thick edge-view slice from the three-dimensional tomographic reconstruction of the boxed area in b. Red arrows indicate the fibrous outer plate. (d) Surface rendering of the outer plate. The outer plate fibres were segmented from the rest of the three-dimensional reconstruction and displayed as a surface-rendered volume using the Amira software. The viewing direction of the surface rendering is indicated by an overlay with the 1.6-nm slice shown in c (see Supplementary Information, Movies 1 and 2). (e–h) Face views of surface renderings of the outer plates from four of the 12 unbound kinetochores examined. The outer plate consistently appears as a network formed from crosslinked fibres that are aligned in the outer plate disk, and often parallel to one another. White arrows indicate long fibres and red arrows indicate crosslinks. The scale bars present 1 μm in a, 400 nm in b, 200 nm in c and 50 nm in e–h.
Figure 2
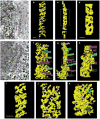
The fibrous network of the outer plate rearranges when microtubules bind. (a–h) Edge-view slices (1.6 nm thick) from the three dimensional reconstructions of kinetochore outer plates in cells treated (a), or untreated (e) with nocodazole to remove all microtubules. Red arrows indicate the outer plate in a. Surface rendered views of kinetochore outer plates in cells treated (b, c) or untreated (f, g) with nocodazole. Face views, as observed from the cytoplasmic side, are shown in b and f. The view in f is 15° from an exact face view. Edge views are shown in c and g. The fibrous network of unbound kinetochore becomes more disorganized and less well aligned in the outer plate when microtubules bind (see Supplementary Information, Movies 2 and 4). Higher-magnification views of boxed areas in c and g are shown in d and h, respectively. White arrows in h indicate fibres that orient along the microtubule axis and bind along the microtubule wall. (i–k) Higher magnification face views of unbound (i) and bound (j, k) kinetochores. The image in i is taken from the upper portion of b, and j and k are taken from the upper and lower portions of f. The kMTs have been digitally removed from j and k to visualize the rearrangement of outer plate fibres on microtubule attachment. The shading in j and k indicates the location of the kMT of the same colour in f. In general, the long fibres seem to disassemble into shorter units and rearrange their orientation on kMT attachment. The scale bars represent 100 nm in a, and 50 nm in b, d and i.
Figure 3
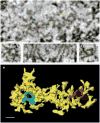
Two distinct mechanisms for kMT attachment in a kinetochore. (a) A face-view slice from the tomographic reconstruction of an en face section (see Methods) of a bound kinetochore. The viewing direction is looking towards the spindle pole. The plus-end tips of two microtubules are indicated by blue and red arrows, and outer plate fibres are indicated by yellow arrows. (b) High-magnification window of the microtubule plus end indicated by the blue arrow in a. Yellow arrows indicate the fibres on the outer plate that bind to the kMT tips in a radial array. (c) An edge-view slice through the three-dimensional reconstruction. Blue and red arrows indicate the same microtubules as in a. The green arrow indicates a fibre extending out of the outer plate to bind the microtubule wall. The green arrowhead indicates the fibres within the outer plate attaching to a kMT plus-end. (d) High-magnification window of the microtubule plus end indicated by the red arrow in a. Yellow arrows indicate the fibres on the outer plate that bind to the kMT tips in a radial array. (e) Surface rendering of the volume viewed from approximately the same orientation as in a. Fibres are attached to the kMT plus ends and link adjacent kMTs. The scale bars represent 25 nm in a, b and e.
Figure 4
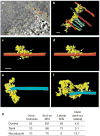
Comparison of the lateral and end-on outer plate attachments to microtubules. (a) A 1.6-nm edge-view slice from the three-dimensional reconstruction of a bound kinetochore, with red arrows indicating a laterally bound microtubule located near the edge of kinetochore. This microtubule is distinct from other kMTs because it extends well beyond the kinetochore without ever going directly through the outer plate. (b) A surface-rendered view of the kinetochore shown in a. The laterally bound microtubule is shown in orange at the top of the figure. (c) Higher-magnification view of the laterally bound microtubule shown in a and b. Outer plate attachments to the microtubule are indicated by white arrows. (d) A laterally bound microtubule from a different kinetochore, with outer plate fibres forming short attachments on the walls (white arrow). (e, f) Microtubules bound end-on, with outer plate fibres attached to the tip of plus ends (e) and on walls (f, white arrows). Note that the outer plate forms similar attachments on the walls of end-on and laterally bound microtubules. (g) The numbers of end-on bound microtubules and laterally bound microtubules found in electron tomographic reconstructions of kinetochores. The scale bars represent 100 nm in a, and 50 nm in b and c.
Figure 5
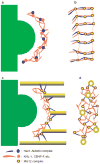
Schematic representation of a network model of the vertebrate kinetochore outer plate. (a, b) Unbound outer plate in the edge (a) and face (b) views. In b, the outer plate appears as a series of roughly parallel bundles of fibres that include the Hec1–Ndc80 complex (blue), KNL-1 (red) and other extended proteins, such as CENP-F (also red). The globular Mis12 complex (yellow circle with a brown border) is shown at the junction between Hec1–Ndc80 and KNL-1 because both the Mis12 complex and KNL-1 are required for recruiting the Hec1–Ndc80 complex to the kinetochore, and to the KNL-1–Mis12–Ndc80 super complex in vitro,. The outer plate undoubtedly contains other globular components corresponding to some of the features in our tomographic reconstructions. From the edge view (a), most of the bundles appear as dots. (c, d) Bound outer plate in the edge (c) and face (d) views. When microtubules attach, the long bundles of fibres dissociate and the Hec1–Ndc80 complex reorients from being in the plane of the outer plate to binding to the microtubule wall at a shallow angle to the microtubule axis (c). Other components in the long bundles (including KNL-1) reorient within the plane of the outer plate to form a radial array of attachments to the plus end tips of kMTs (d). Presumably, the Hec1–Ndc80 complex is also able to form attachments to the walls of laterally associated microtubules. The chromosome, heterochromatin and inner centromere are shown in green in a and c.
Similar articles
- Hec1 and nuf2 are core components of the kinetochore outer plate essential for organizing microtubule attachment sites.
DeLuca JG, Dong Y, Hergert P, Strauss J, Hickey JM, Salmon ED, McEwen BF. DeLuca JG, et al. Mol Biol Cell. 2005 Feb;16(2):519-31. doi: 10.1091/mbc.e04-09-0852. Epub 2004 Nov 17. Mol Biol Cell. 2005. PMID: 15548592 Free PMC article. - Antagonism between the dynein and Ndc80 complexes at kinetochores controls the stability of kinetochore-microtubule attachments during mitosis.
Amin MA, McKenney RJ, Varma D. Amin MA, et al. J Biol Chem. 2018 Apr 20;293(16):5755-5765. doi: 10.1074/jbc.RA117.001699. Epub 2018 Feb 23. J Biol Chem. 2018. PMID: 29475948 Free PMC article. - Looping in on Ndc80 - how does a protein loop at the kinetochore control chromosome segregation?
Nilsson J. Nilsson J. Bioessays. 2012 Dec;34(12):1070-7. doi: 10.1002/bies.201200096. Bioessays. 2012. PMID: 23154893 - Kinetochore-microtubule coupling mechanisms mediated by the Ska1 complex and Cdt1.
Rahi A, Chakraborty M, Vosberg K, Varma D. Rahi A, et al. Essays Biochem. 2020 Sep 4;64(2):337-347. doi: 10.1042/EBC20190075. Essays Biochem. 2020. PMID: 32844209 Free PMC article. Review. - Contrasting models for kinetochore microtubule attachment in mammalian cells.
McEwen BF, Dong Y. McEwen BF, et al. Cell Mol Life Sci. 2010 Jul;67(13):2163-72. doi: 10.1007/s00018-010-0322-x. Epub 2010 Mar 25. Cell Mol Life Sci. 2010. PMID: 20336345 Free PMC article. Review.
Cited by
- Tubulin depolymerization may be an ancient biological motor.
McIntosh JR, Volkov V, Ataullakhanov FI, Grishchuk EL. McIntosh JR, et al. J Cell Sci. 2010 Oct 15;123(Pt 20):3425-34. doi: 10.1242/jcs.067611. J Cell Sci. 2010. PMID: 20930138 Free PMC article. Review. - The Drosophila kinesin-13, KLP59D, impacts Pacman- and Flux-based chromosome movement.
Rath U, Rogers GC, Tan D, Gomez-Ferreria MA, Buster DW, Sosa HJ, Sharp DJ. Rath U, et al. Mol Biol Cell. 2009 Nov;20(22):4696-705. doi: 10.1091/mbc.e09-07-0557. Epub 2009 Sep 30. Mol Biol Cell. 2009. PMID: 19793918 Free PMC article. - The unconventional kinetoplastid kinetochore: from discovery toward functional understanding.
Akiyoshi B. Akiyoshi B. Biochem Soc Trans. 2016 Oct 15;44(5):1201-1217. doi: 10.1042/BST20160112. Biochem Soc Trans. 2016. PMID: 27911702 Free PMC article. Review. - Heterogeneous architecture of vertebrate kinetochores revealed by three-dimensional superresolution fluorescence microscopy.
Wynne DJ, Funabiki H. Wynne DJ, et al. Mol Biol Cell. 2016 Nov 7;27(22):3395-3404. doi: 10.1091/mbc.E16-02-0130. Epub 2016 May 11. Mol Biol Cell. 2016. PMID: 27170176 Free PMC article. - Kinetochore flexibility: creating a dynamic chromosome-spindle interface.
O'Connell CB, Khodjakov A, McEwen BF. O'Connell CB, et al. Curr Opin Cell Biol. 2012 Feb;24(1):40-7. doi: 10.1016/j.ceb.2011.12.008. Epub 2012 Jan 3. Curr Opin Cell Biol. 2012. PMID: 22221609 Free PMC article. Review.
References
- Tanaka TU, Stark MJ, Tanaka K. Kinetochore capture and bi-orientation on the mitotic spindle. Nature Rev Mol Cell Biol. 2005;6:929–942. - PubMed
- Maiato H, Deluca J, Salmon ED, Earnshaw WC. The dynamic kinetochore-microtubule interface. J Cell Sci. 2004;117:5461–5477. - PubMed
- McIntosh JR, Grishchuk EL, West RR. Chromosome-microtubule interactions during mitosis. Annu Rev Cell Dev Biol. 2002;18:193–219. - PubMed
- Desai A, Mitchison TJ. Microtubule polymerization dynamics. Annu Rev Cell Dev Biol. 1997;13:83–117. - PubMed
Publication types
MeSH terms
Substances
Grants and funding
- P41 RR01219/RR/NCRR NIH HHS/United States
- R01 GM066270-05A1/GM/NIGMS NIH HHS/United States
- R01 GM06627/GM/NIGMS NIH HHS/United States
- GM59363/GM/NIGMS NIH HHS/United States
- R01 GM059363/GM/NIGMS NIH HHS/United States
- P41 RR001219/RR/NCRR NIH HHS/United States
- R01 GM059363-09/GM/NIGMS NIH HHS/United States
- R01 GM066270/GM/NIGMS NIH HHS/United States
LinkOut - more resources
Full Text Sources
Other Literature Sources
Miscellaneous
