Inflammatory monocytes recruited after skeletal muscle injury switch into antiinflammatory macrophages to support myogenesis - PubMed (original) (raw)
Comparative Study
. 2007 May 14;204(5):1057-69.
doi: 10.1084/jem.20070075. Epub 2007 May 7.
Affiliations
- PMID: 17485518
- PMCID: PMC2118577
- DOI: 10.1084/jem.20070075
Comparative Study
Inflammatory monocytes recruited after skeletal muscle injury switch into antiinflammatory macrophages to support myogenesis
Ludovic Arnold et al. J Exp Med. 2007.
Abstract
Macrophages (MPs) are important for skeletal muscle regeneration in vivo and may exert beneficial effects on myogenic cell growth through mitogenic and antiapoptotic activities in vitro. However, MPs are highly versatile and may exert various, and even opposite, functions depending on their activation state. We studied monocyte (MO)/MP phenotypes and functions during skeletal muscle repair. Selective labeling of circulating MOs by latex beads in CX3CR1(GFP/+) mice showed that injured muscle recruited only CX3CR1(lo)/Ly-6C(+) MOs from blood that exhibited a nondividing, F4/80(lo), proinflammatory profile. Then, within muscle, these cells switched their phenotype to become proliferating antiinflammatory CX3CR1(hi)/Ly-6C(-) cells that further differentiated into F4/80(hi) MPs. In vitro, phagocytosis of muscle cell debris induced a switch of proinflammatory MPs toward an antiinflammatory phenotype releasing transforming growth factor beta1. In co-cultures, inflammatory MPs stimulated myogenic cell proliferation, whereas antiinflammatory MPs exhibited differentiating activity, assessed by both myogenin expression and fusion into myotubes. Finally, depletion of circulating MOs in CD11b-diphtheria toxin receptor mice at the time of injury totally prevented muscle regeneration, whereas depletion of intramuscular F4/80(hi) MPs at later stages reduced the diameter of regenerating fibers. In conclusion, injured skeletal muscle recruits MOs exhibiting inflammatory profiles that operate phagocytosis and rapidly convert to antiinflammatory MPs that stimulate myogenesis and fiber growth.
Figures
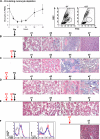
Figure 1.
Kinetics of MO/MP subsets during muscle regeneration in the CX3CR1GFP/+ mouse. (A) CD45+ cells present in injured muscle were analyzed for Ly-6C and GFP (CX3CR1) expression by flow cytometry. (top) Results are expressed as the percentage of CD45+ cells isolated from muscle and represent the means ± SD of three experiments. (bottom) Representative examples of FACS analysis at each time point. The two circles represent the two gated MO populations. (B) Total number of MOs/MPs was calculated from results obtained in A, and the number of isolated CD45+ cells were plotted to muscle weight. Results represent the means ± SD of three experiments. (C) Representative hematoxylin and eosin staining of muscle sections at various times after notexin injection. Bar, 50 μm.
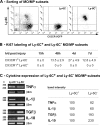
Figure 2.
Phenotype of Ly-6C+ and Ly-6C− MOs/MPs during muscle regeneration. Ly-6C+ and Ly-6C− MO/MP subsets were isolated by cell sorting at various times after injury. (A) Representative example of cell sorting of Ly-6C− (middle) and Ly-6C+ (right) cells from whole MOs/MPs (left) at day 4 after injury. (B) Ki67 immunostaining is expressed as the percentage of isolated MOs/MPs. (C) Expression of TNF-α, IL-1β, TGF-β1, and IL-10 was analyzed by RT-PCR in isolated populations at day 4 after injury. Corresponding band intensities are given as the means of three experiments.
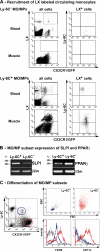
Figure 3.
Fate of Ly-6C+ and Ly-6C− MOs/MPs during muscle regeneration. (A) Circulating Ly-6C− (top) and Ly-6C+ (bottom) MOs were labeled with LX red microspheres and analyzed by flow cytometry. LX+ CD45+ GFP+ cells (gates in all cells; left) were analyzed for Ly-6C expression (LX+ cells; right) in both blood and muscle at day 3 (for Ly-6C− labeling) and day 2 (for Ly-6C+ labeling) after injury. Results are representative of three experiments. (B) SLPI and PPAR-γ expression was analyzed by RT-PCR in Ly-6C+ and Ly-6C− MOs/MPs sorted at day 4 after injury. (C) Flow cytometry analysis of forward scatter (FSC)/side scatter (SSC) characteristics, F4/80 and CD11c expression of Ly-6C+ (blue), and Ly-6C− (red) MOs/MPs sorted at day 7 after injury (black dotted line, isotypic control). Results are representative of three experiments.
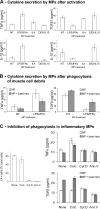
Figure 4.
Phagocytosis and cytokine secretion by activated MPs. Cytokine secretion was evaluated by ELISA in MP-conditioned medium. (A) Cytokine secretion by untreated (NT) and LPS/IFN-γ–, IL-4–, and DEX/IL-10–treated MPs. (B) Cytokine secretion by untreated (NT) and LPS/IFN-γ– treated MPs after phagocytosis of muscle cell debris. (C, left) Phagocytosis of LXs by LPS/IFN-γ–treated MPs incubated or not (none) with colchicine (colc), cytochalasin D (cyt D), or recombinant Annexin V (Ann.V). (right) Cytokine secretion by LPS/IFN-γ–treated MPs after phagocytosis of muscle cell debris in the presence of the same effectors. Results represent the means ± SEM of three experiments.
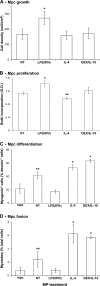
Figure 5.
Effects of activated MPs on mpc fate. mpcs were co-cultured with untreated (NT) and LPS/IFN-γ–, IL-4–, and DEX/IL-10–treated MPs and further analyzed for their (A) growth, (B) proliferation, (C) differentiation, and (D) fusion. All parameters were analyzed at day 3 of co-culture except for BrdU incorporation, which was monitored during 24 h of co-culture. Results represent the means ± SEM of three experiments. Asterisks above bars indicate significant differences (P < 0.05).
Figure 6.
Effects of circulating MO depletion on skeletal muscle regeneration. (A, left) Kinetics of circulating MO depletion after one i.v. DT injection. Results represent the means ± SD of at least four experiments. (right) Examples of FACS analysis of blood before (−DT) and 18 h after i.v. DT injection (+DT). Circles show MO gate. (B–F) Notexin (Nx) was injected into the TA of CD11b-DTR mice at day 0, and DT was injected i.v. at various times, as indicated by the red arrows. Muscle histology was analyzed until day 7 after hematoxylin and eosin staining. Results are representative of at least two independent experiments. (F, inset) CD45+ cells were isolated from muscle and analyzed for F4/80 and CD11b expression 24 h after an i.v. DT (blue line) or PBS (red line) injection at day 4 after injury (black dotted line, isotypic control). Bar, 50 μm.
Figure 7.
Quantitative analysis of muscle regeneration after circulating MO depletion. CD11b-DTR mice were treated as in Fig. 6, and in each case the number of (A) necrotic myofibers, (B) phagocyted myofibers, (C) regenerating basic myofibers, and (D) centrally nucleated regenerating myofibers was evaluated. Closed squares represent the control corresponding to Fig. 6 B; open diamonds represent simultaneous DT and notexin injections corresponding to Fig. 6 C; open triangles represent a DT injection 12 h before notexin injection corresponding to Fig. 6 D; open squares represent a double DT injection corresponding to Fig. 6 E; and closed circles represent a DT injection 4 d after notexin injection corresponding to Fig. 6 F. Results are expressed as the percentage of total counted myofibers and are the means of at least two experiments.
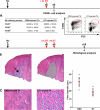
Figure 8.
Effects of i.m. DT injection on skeletal muscle regeneration. Notexin (Nx) was injected into the TA of CD11b-DTR mice at day 0, and DT was injected in the same muscle at day 5 (A) and days 5 and 6 (B and C). (A) 24 h after a single i.m. DT injection, CD45+ cells were isolated from muscle and analyzed for F4/80 expression. Red circles enclose FSChi/F4/80hi cells. (B) Reconstituted whole view of TA muscle at day 10 after Notexin injection (hematoxylin and eosin staining), presenting hallmarks of secondary regeneration restricted to the site of needle puncture (arrow). (right) Hatched area represents the area excluded from analysis. Bar, 200 μm. (C) PBS- and DT-injected muscles were analyzed at day 10 after injury for myofiber diameter evaluation (hematoxylin and eosin staining). Quantified results are given for three independent experiments, with each point corresponding to a field (red bars represent the means). Bar, 50 μm.
Similar articles
- Muscle resident macrophages control the immune cell reaction in a mouse model of notexin-induced myoinjury.
Brigitte M, Schilte C, Plonquet A, Baba-Amer Y, Henri A, Charlier C, Tajbakhsh S, Albert M, Gherardi RK, Chrétien F. Brigitte M, et al. Arthritis Rheum. 2010 Jan;62(1):268-79. doi: 10.1002/art.27183. Arthritis Rheum. 2010. PMID: 20039420 - Dual and beneficial roles of macrophages during skeletal muscle regeneration.
Chazaud B, Brigitte M, Yacoub-Youssef H, Arnold L, Gherardi R, Sonnet C, Lafuste P, Chretien F. Chazaud B, et al. Exerc Sport Sci Rev. 2009 Jan;37(1):18-22. doi: 10.1097/JES.0b013e318190ebdb. Exerc Sport Sci Rev. 2009. PMID: 19098520 Review. - Differentially activated macrophages orchestrate myogenic precursor cell fate during human skeletal muscle regeneration.
Saclier M, Yacoub-Youssef H, Mackey AL, Arnold L, Ardjoune H, Magnan M, Sailhan F, Chelly J, Pavlath GK, Mounier R, Kjaer M, Chazaud B. Saclier M, et al. Stem Cells. 2013 Feb;31(2):384-96. doi: 10.1002/stem.1288. Stem Cells. 2013. PMID: 23169615 - Macrophages recruited via CCR2 produce insulin-like growth factor-1 to repair acute skeletal muscle injury.
Lu H, Huang D, Saederup N, Charo IF, Ransohoff RM, Zhou L. Lu H, et al. FASEB J. 2011 Jan;25(1):358-69. doi: 10.1096/fj.10-171579. Epub 2010 Oct 1. FASEB J. 2011. PMID: 20889618 Free PMC article. - Monocyte/macrophage interactions with myogenic precursor cells during skeletal muscle regeneration.
Saclier M, Cuvellier S, Magnan M, Mounier R, Chazaud B. Saclier M, et al. FEBS J. 2013 Sep;280(17):4118-30. doi: 10.1111/febs.12166. Epub 2013 Feb 28. FEBS J. 2013. PMID: 23384231 Review.
Cited by
- Proinflammatory macrophages enhance the regenerative capacity of human myoblasts by modifying their kinetics of proliferation and differentiation.
Bencze M, Negroni E, Vallese D, Yacoub-Youssef H, Chaouch S, Wolff A, Aamiri A, Di Santo JP, Chazaud B, Butler-Browne G, Savino W, Mouly V, Riederer I. Bencze M, et al. Mol Ther. 2012 Nov;20(11):2168-79. doi: 10.1038/mt.2012.189. Epub 2012 Oct 16. Mol Ther. 2012. PMID: 23070116 Free PMC article. - Interleukin-6/signal transducer and activator of transcription 3 (STAT3) pathway is essential for macrophage infiltration and myoblast proliferation during muscle regeneration.
Zhang C, Li Y, Wu Y, Wang L, Wang X, Du J. Zhang C, et al. J Biol Chem. 2013 Jan 18;288(3):1489-99. doi: 10.1074/jbc.M112.419788. Epub 2012 Nov 26. J Biol Chem. 2013. PMID: 23184935 Free PMC article. - Pentosan Polysulfate: a Novel Glycosaminoglycan-Like Molecule for Effective Treatment of Alphavirus-Induced Cartilage Destruction and Inflammatory Disease.
Herrero LJ, Foo SS, Sheng KC, Chen W, Forwood MR, Bucala R, Mahalingam S. Herrero LJ, et al. J Virol. 2015 Aug;89(15):8063-76. doi: 10.1128/JVI.00224-15. Epub 2015 May 27. J Virol. 2015. PMID: 26018160 Free PMC article. - Macrophages augment the skeletal muscle proinflammatory response through TNFα following LPS-induced acute lung injury.
Bivona JJ 3rd, Crymble HM, Guigni BA, Stapleton RD, Files DC, Toth MJ, Poynter ME, Suratt BT. Bivona JJ 3rd, et al. FASEB J. 2021 Apr;35(4):e21462. doi: 10.1096/fj.202002275RR. FASEB J. 2021. PMID: 33724561 Free PMC article. - Systemic analysis of PPARγ in mouse macrophage populations reveals marked diversity in expression with critical roles in resolution of inflammation and airway immunity.
Gautier EL, Chow A, Spanbroek R, Marcelin G, Greter M, Jakubzick C, Bogunovic M, Leboeuf M, van Rooijen N, Habenicht AJ, Merad M, Randolph GJ. Gautier EL, et al. J Immunol. 2012 Sep 1;189(5):2614-24. doi: 10.4049/jimmunol.1200495. Epub 2012 Aug 1. J Immunol. 2012. PMID: 22855714 Free PMC article.
References
- Lapidot, T., and I. Petit. 2002. Current understanding of stem cell mobilization: the roles of chemokines, proteolytic enzymes, adhesion molecules, cytokines, and stromal cells. Exp. Hematol. 30:973–981. - PubMed
- Gordon, S., and P.R. Taylor. 2005. Monocyte and macrophage heterogeneity. Nat. Rev. Immunol. 5:953–964. - PubMed
- Gordon, S. 1995. The macrophage. Bioessays. 17:977–986. - PubMed
- Gordon, S. 2003. Alternative activation of macrophages. Nat. Rev. Immunol. 3:23–35. - PubMed
Publication types
MeSH terms
Substances
LinkOut - more resources
Full Text Sources
Other Literature Sources
Molecular Biology Databases
Research Materials

