Polarity reveals intrinsic cell chirality - PubMed (original) (raw)
Polarity reveals intrinsic cell chirality
Jingsong Xu et al. Proc Natl Acad Sci U S A. 2007.
Abstract
Like blood neutrophils, dHL60 cells respond to a uniform concentration of attractant by polarizing in apparently random directions. How each cell chooses its own direction is unknown. We now find that an arrow drawn from the center of the nucleus of an unpolarized cell to its centrosome strongly predicts the subsequent direction of attractant-induced polarity: Of 60 cells that polarized in response to uniform f-Met-Leu-Phe (fMLP), 42 polarized to the left of this arrow, 6 polarized to the right, and 12 polarized directly toward or away from the centrosome. To investigate this directional bias we perturbed a regulatory pathway, downstream of Cdc42 and partitioning-defective 6 (Par6), which controls centrosome orientation relative to polarity of other cells. Dominant negative Par6 mutants block polarity altogether, as previously shown for disrupting Cdc42 activity. Cells remain able to polarize, but without directional bias, if their microtubules are disrupted with nocodazole, or they express mutant proteins that interfere with activities of PKCzeta or dynein. Expressing constitutively active glycogen synthase kinase 3beta (GSK3beta) causes cells to polarize preferentially to the right. Distributions of most of these polarity regulators localize to the centrosome but show no left-right asymmetry before polarization. Together, these findings suggest that an intrinsically chiral structure, perhaps the centrosome, serves as a template for directing polarity in the absence of spatial cues. Such a template could help to determine left-right asymmetry and planar polarity in development.
Conflict of interest statement
The authors declare no conflict of interest.
Figures
Fig. 1.
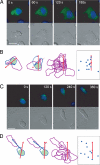
Leftward bias of differentiated HL-60 (dHL-60) cell polarity. The bias of cell polarity was assessed by observing the locations of an individual cell's centrosome at two different times: before exposure to uniform fMLP by using GFP-Arr3 (A and B) or GFP-N- Clip170 (C and D) as markers and again when polarity was complete (180 or 360 s after application of fMLP in A and B or C and D, respectively). (A) dHL-60 cells were transiently transfected with GFP-Arr3 and uniformly stimulated with fMLP (100 nM) for the times indicated. GFP-Arr3 fluorescence (green) and nuclei (blue) are shown in the Upper images, and the corresponding Nomarski images are shown in the Lower images. (B) Leftward bias of cell polarity. In the first figure (far left), the cell outline from A is shown in blue (0 s) and purple (180 s after fMLP); centrosome positions are indicated by the red and blue dots (at 0 and 180 s, respectively) and are linked with a straight blue line; the red arrow is drawn through the center of the nucleus (light green), pointing to the centrosome, at 0 s. The second figure (second from the left) shows cell outlines and centrosome positions, at 0 and 180 s, rotated so that the arrow points directly upward. The third figure (second from the right) shows outlines of 13 GFP-Arr3 expressed cells at 180 s, all corrected so that their red arrows point in the same direction. The fourth figure (far right) shows the locations of centrosomes at 180 s. Only 1 of 13 cells polarized to the right side of the arrow. (C) (Upper) dHL-60 cells were transiently transfected with GFP-N-Clip170, and uniformly stimulated with fMLP (100 nM) for the times indicated. GFP-N-Clip170 fluorescence is green; nuclei are in blue. (Lower) The corresponding Nomarski images. (D) Outlines and centrosome positions of the cell in C at 0 and 360 s after fMLP addition are shown exactly as described in B. Of 11 GFP-N-Clip170-expressing cells, only 1 turned to the right of the arrow. (Scale bars, 10 μm.)
Fig. 2.
Perturbing leftward bias. We assessed effects on leftward bias of perturbing either microtubules (A) or activities of three proteins thought to regulate polarity in other cells (B). (A) dHL-60 cells expressing GFP-N-Clip170 were subjected to no drug (Left), nocodazole (20 μM, 40 min) (Center), or 2 h after multiple washes with RPMI medium (Right), and then exposed to uniform fMLP (100 nM). Centrosome positions of the cells after polarization in response to fMLP are indicated by filled or empty blue circles, representing cells that expressed either of two centrosome markers, GFP-N-Clip170 or GFP-Arr3, respectively. For all GFP-N-Clip170-expressing cells, centrosome positions relative to the arrow were recorded at 360 s after exposure to fMLP, as described in the legend of Fig. 1_D_. Centrosome positions of GFP-Arr3-expressing cells (confined to the Center figure) were recorded at 180 s after exposure to fMLP, because these cells polarized more rapidly than cells expressing the other marker as described in the text. Thus the appropriate controls for the empty circles in this Center figure are the 13 GFP-Arr3-expressing cells whose positions after 180 s exposure to fMLP are depicted in Fig. 1_B_. Regardless of the centrosome marker used, the leftward bias of polarity was not detected after treatment with nocodazole (Center) but was restored after nocodazole was removed (Right). (Scale bar, 20 μm.) (B) dHL-60 cells were transiently cotransfected with GFP-N-Clip170 and one of following mutant constructs: PKCζ-KD (Left), p50-dynamitin (Center) GSK3β -S9A (Right), and then exposed to uniform fMLP (100 nM). Centrosome positions 360 s later were assessed as described in the legend to Fig. 1_B_. Whereas both PKCζ-KD and p50-dynamitin abolish the leftward bias, GSK3β -S9A reverses it. (Scale bar, 20 μm.)
Fig. 3.
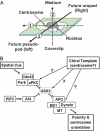
Potential chirality axes (A) and possible regulators of leftward polarity bias (B). (A) Schematic diagram of an unpolarized cell resting on a coverslip, showing three chirality axes. Axis 1 is the arrow drawn from the center of the nucleus through the centrosome, and axis 2 is the vertical axis, from coverslip to medium. Orthogonal to the first two axes, axis 3 is the predicted direction of polarity to be assumed by the cell after addition of uniform fMLP: the pseudopod will be on the left, and the uropod will be on the right. (B) The diagram presents postulated relations among regulatory molecules we speculate may be involved in executing the leftward polarity bias of dHL60 cells. Solid lines connecting elements in the pathway represent steps documented in regulation of polarity and centrosome orientation in astrocytes and neurons (–10). Dotted arrows with question marks indicate speculative links between a proposed chiral template and possible target steps in the pathway.
Similar articles
- Cdc42 regulates GSK-3beta and adenomatous polyposis coli to control cell polarity.
Etienne-Manneville S, Hall A. Etienne-Manneville S, et al. Nature. 2003 Feb 13;421(6924):753-6. doi: 10.1038/nature01423. Epub 2003 Jan 29. Nature. 2003. PMID: 12610628 - Cdc42 and noncanonical Wnt signal transduction pathways cooperate to promote cell polarity.
Schlessinger K, McManus EJ, Hall A. Schlessinger K, et al. J Cell Biol. 2007 Jul 30;178(3):355-61. doi: 10.1083/jcb.200701083. Epub 2007 Jul 23. J Cell Biol. 2007. PMID: 17646398 Free PMC article. - GSK3beta and PKCzeta function in centrosome localization and process stabilization during Slit-mediated neuronal repolarization.
Higginbotham H, Tanaka T, Brinkman BC, Gleeson JG. Higginbotham H, et al. Mol Cell Neurosci. 2006 May-Jun;32(1-2):118-32. doi: 10.1016/j.mcn.2006.03.003. Epub 2006 May 6. Mol Cell Neurosci. 2006. PMID: 16682216 - The interdependence of the Rho GTPases and apicobasal cell polarity.
Mack NA, Georgiou M. Mack NA, et al. Small GTPases. 2014;5(2):10. doi: 10.4161/21541248.2014.973768. Small GTPases. 2014. PMID: 25469537 Free PMC article. Review. - Molecular mechanisms of axon specification and neuronal disorders.
Yoshimura T, Arimura N, Kaibuchi K. Yoshimura T, et al. Ann N Y Acad Sci. 2006 Nov;1086:116-25. doi: 10.1196/annals.1377.013. Ann N Y Acad Sci. 2006. PMID: 17185510 Review.
Cited by
- Cell chirality: emergence of asymmetry from cell culture.
Wan LQ, Chin AS, Worley KE, Ray P. Wan LQ, et al. Philos Trans R Soc Lond B Biol Sci. 2016 Dec 19;371(1710):20150413. doi: 10.1098/rstb.2015.0413. Philos Trans R Soc Lond B Biol Sci. 2016. PMID: 27821525 Free PMC article. Review. - Far from solved: a perspective on what we know about early mechanisms of left-right asymmetry.
Vandenberg LN, Levin M. Vandenberg LN, et al. Dev Dyn. 2010 Dec;239(12):3131-46. doi: 10.1002/dvdy.22450. Dev Dyn. 2010. PMID: 21031419 Free PMC article. Review. - Cell Chirality as a Novel Measure for Cytotoxicity.
Zhang H, Wan LQ. Zhang H, et al. Adv Biol (Weinh). 2022 Jan;6(1):e2101088. doi: 10.1002/adbi.202101088. Epub 2021 Nov 19. Adv Biol (Weinh). 2022. PMID: 34796704 Free PMC article. Review. - Retrotaxis of human neutrophils during mechanical confinement inside microfluidic channels.
Hamza B, Wong E, Patel S, Cho H, Martel J, Irimia D. Hamza B, et al. Integr Biol (Camb). 2014 Feb;6(2):175-83. doi: 10.1039/c3ib40175h. Integr Biol (Camb). 2014. PMID: 24419464 Free PMC article. - Multiaxial Polarity Determines Individual Cellular and Nuclear Chirality.
Raymond MJ Jr, Ray P, Kaur G, Fredericks M, Singh AV, Wan LQ. Raymond MJ Jr, et al. Cell Mol Bioeng. 2017 Feb;10(1):63-74. doi: 10.1007/s12195-016-0467-2. Epub 2016 Sep 12. Cell Mol Bioeng. 2017. PMID: 28360944 Free PMC article.
References
Publication types
MeSH terms
Substances
Grants and funding
- R37 GM027800/GM/NIGMS NIH HHS/United States
- GM 27800/GM/NIGMS NIH HHS/United States
- R01 GM025101/GM/NIGMS NIH HHS/United States
- R01 GM027800/GM/NIGMS NIH HHS/United States
- R01 GM 025101/GM/NIGMS NIH HHS/United States
- R01 RR 14892/RR/NCRR NIH HHS/United States
LinkOut - more resources
Full Text Sources
Other Literature Sources
Miscellaneous


