Caveolin-1 regulates cell polarization and directional migration through Src kinase and Rho GTPases - PubMed (original) (raw)
Caveolin-1 regulates cell polarization and directional migration through Src kinase and Rho GTPases
Araceli Grande-García et al. J Cell Biol. 2007.
Abstract
Development, angiogenesis, wound healing, and metastasis all involve the movement of cells in response to changes in the extracellular environment. To determine whether caveolin-1 plays a role in cell migration, we have used fibroblasts from knockout mice. Caveolin-1-deficient cells lose normal cell polarity, exhibit impaired wound healing, and have decreased Rho and increased Rac and Cdc42 GTPase activities. Directional persistency of migration is lost, and the cells show an impaired response to external directional stimuli. Both Src inactivation and p190RhoGAP knockdown restore the wild-type phenotype to caveolin-1-deficient cells, suggesting that caveolin-1 stimulates normal Rho GTP loading through inactivation of the Src-p190RhoGAP pathway. These findings highlight the importance of caveolin-1 in the establishment of cell polarity during directional migration through coordination of the signaling of Src kinase and Rho GTPases.
Figures
Figure 1.
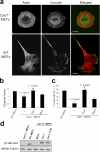
Cav1−/− MEFs show a defect in stress fiber architecture and FAs. (a) WT and Cav1−/− MEFs were plated on Fn, fixed, and stained with rhodamine phalloidin to reveal the morphology of the actin cytoskeleton. FAs were stained with a mAb to vinculin followed by FITC-conjugated anti-rabbit IgG. Bars, 20 μm. (b) The EF (length/breadth), used as a measure of cell polarization, was calculated for WT MEFs (n = 797), Cav1−/− MEFs (n = 663), Cav1-reconstituted knockout MEFs (n = 481), and knockout MEFs stably transfected with the empty vector (mock; n = 450) plated on Fn. Error bars indicate SEM from five separate experiments. (c) The percentage of cells with EF >2 was calculated for each cell line. Error bars indicate SEM. (d) WT MEFs, Cav1−/− MEFs, and Cav1−/− MEFs reconstituted with empty vector (mock), caveolin-1, or caveolin-1 Y14F were lysed and immunoblotted against caveolin-1 and tubulin. Exogenous caveolin-1 is flag tagged.
Figure 2.
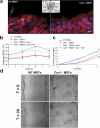
Polarity is impaired in Cav1−/− MEFs. (a) MEF monolayers were fixed 2, 4, 6, and 8 h after scratching and immunostained for DNA (blue), actin (red), and pericentrin (green), a marker for the MTOC. Representative wound-edge WT and Cav1−/− MEFs are shown. The criteria for MTOC polarization is explained in the diagram. Bar, 20 μm. (b) The percentage of cells in the front row showing reoriented MTOC was measured at the indicated times after wounding. For each time point, 150–300 cells were scored. Values represent means ± SEM of three independent experiments. (c) Graphical representation of wound closure in WT MEFs, Cav1−/− MEFs, and Cav1−/− MEFs reconstituted with caveolin-1 or caveolin-1 Y14F are shown. The percentage of closure was measured at 4 and 8 h after wounding. Error bars show SEM from six independent experiments. For 4 h, p values are as follows: *, P = 0.024 (Cav1−/− versus WT
mef
s); #, P = 0.033 (Cav1−/− + Cav1 versus Cav1−/− MEFs); ζ, P = 0.039 (Cav1−/− + Cav1Y14F versus WT MEFs). For 8 h, p values are as follows: *, P = 0.020 (Cav1−/− versus WT
mef
s); #, P = 0.042 (Cav1−/− + Cav1 versus Cav1−/− MEFs); ζ, P = 0.049 (Cav1−/− + Cav1Y14F versus WT MEFs). (d) WT and Cav1−/− MEF monolayers were scraped with a plastic pipette tip and photographed immediately (t = 0) or after 24 h (t = 24).
Figure 3.
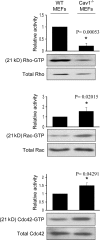
Cav1−/− MEFs show alterations in the activity of Rho GTPases. WT and Cav1−/− MEFs were lysed, and pull-down assays were performed as described in Materials and methods. Proteins bound to GST-PAK binding domain (for Rac and Cdc42) or GST-Rhotekin binding domain (for Rho) were separated by 13% SDS-PAGE, transferred to a polyvinylidene difluoride membrane, and immunoblotted with one of the following antibodies: anti-Rho, anti-Rac1, or anti-Cdc42. Representative Western blots of each GTPase are shown. The diagrams illustrate densitometric analysis of the relative activities of Rho, Rac, and Cdc42, normalized for whole cell lysates and expressed as a ratio to WT MEFs (means ± SEM of five to six independent experiments). *, Statistically significant versus WT MEFs.
Figure 4.
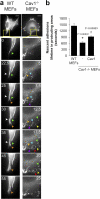
Cells lacking caveolin-1 show accelerated turnover of nascent adhesions at protruding areas. (a) Cells were transiently transfected with pEGFP-paxillin and plated on an Fn matrix, and turnover of newly forming adhesions in protruding areas was monitored by time-lapse video microscopy. Seven frames of two representative cells are shown. The lifetime of several adhesions was followed and pointed with colored arrowheads. Each color indicates a different adhesion. Bars, 20 μm. (b) The lifetimes of adhesions were determined in 16 WT cells (274 FAs), 15 Cav1−/− MEFs (376 FAs), and 10 Cav1−/− MEFs reconstituted with caveolin-1 (354 FAs). Values are means ± SEM. *, Statistically significant versus WT MEFs; #, statistically significant versus Cav1−/− MEFs.
Figure 5.
Cells lacking caveolin-1 show enhanced protrusive activity. (a) The time-lapse paxillin videos (Fig. 4) were used to calculate cell protrusion as described in Materials and methods. Six subtracted consecutive frames of two representative cells are shown. White areas are the protruded edges, and black areas are retracted edges between two consecutive frames. White arrows indicate the direction of cell movement in the WT cell, and asterisks point to large protrusive areas. Note that Cav1−/− MEFs did not persistently move in a defined direction. Areas of protrusions (b) and retractions (c) were meas ured and plotted. Data shown are means ± SD. *, Statistically significant versus WT MEFs. Bars, 20 μm.
Figure 6.
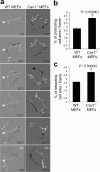
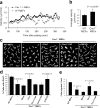
Directional migration is impaired in Cav1−/− MEFs and can be rescued by WT Cav1 and p190RhoGAP knockdown, but not by Cav1Y14F. WT and Cav1−/− MEFs plated on Fn were recorded in random migration by time-lapse video microscopy during a 10-h period (8-min frame interval). (a) Instantaneous velocities of 580–600 cells of each type were quantified and plotted over time on Fn. Cell densities of both populations were equivalent (not depicted). (b) Histograms represent the mean velocities over the 90–330-min period, at which time steady-state velocities were reached. (c) White lines show representative migration tracks of the cell lines indicated at the top of each panel. Composite migration figures were created by coping randomly selected individual migration paths and combining them into a single figure to avoid empty spaces (Pankov et al., 2005). (d) The ID was quantified with Matlab and MetaMorph software. Histograms display the percentage of cells with ID > 0.3 in each cell line. This value (0.3) was the highest mean ID displayed in all experimental conditions tested, and therefore the percentage of cells with ID > 0.3 represents highly directional migratory cells. Data represent means ± SEM based on six independent experiments. n = 300–500 cells of each line. (e) Transwell filters coated with Fn were used to measure the chemotactic response of WT MEFs, Cav1−/− MEFs, and Cav1−/− MEFs reconstituted with caveolin-1 or caveolin-1 Y14F using serum as a stimulus. Cells that had migrated during 4 h to the lower surface of the filters were counted in five random fields. Means ± SD from four independent experiments are shown. *, Statistically significant versus WT MEFs; #, statistically significant versus Cav1−/− MEFs.
Figure 7.
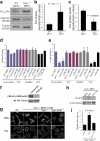
Altered phenotype of Cav1−/− fibroblasts is dependent on Src and p190RhoGAP. (a) Activated and total Src were assayed by Western blotting with anti-Src(pY418) phosphospecific antibody and anti-Src pan antibody, respectively. Each of the illustrated blots is representative of five experiments. (b) Src activity was determined densitometrically and expressed as the Src(pY418)/Src ratio. (c) Src protein levels were normalized to tubulin levels in each sample. Values depict means ± SEM of five independent experiments. (d) Both Src inhibition and p190RhoGAP knockdown in Cav1−/− MEFs restore the WT morphology pattern. EF was calculated for Cav1−/− MEFs treated with two different Src inhibitors, PP2 and SU6656. PP3 was used as a negative control. Data indicate means ± SEM (n = 3). (e) Percentages of cells with EF >2 are shown for each population (n >100 cells per condition). Values represent means ± SEM from three independent experiments. (f) Cav1−/− MEFs were infected with retroviruses encoding for control (control KD) or p190RhoGAP shRNA (p190 KD). Positive cells were sorted, and knock down was confirmed by a Western blot against p190RhoGAP. As a loading control, anti-tubulin immunoblot is shown. 95% reduction in p190RhoGAP levels was obtained. (g) Cells were plated on Fn-coated plates for 4 h, fixed, and stained with anti-paxillin antibodies. Representative images of each cell line are shown. Fibs, thymus fibroblasts. Bars, 20 μm. (h) Cav1−/− MEFs reconstituted with empty vector (mock), caveolin-1, or caveolin-1 Y14F were lysed, and pull-down assays were performed as described in Materials and methods. Proteins bound to GST-Rhotekin binding domain (top) and whole cell lysates (bottom) were separated on a 13% SDS-PAGE, transferred to a polyvinylidene difluoride membrane, and immunoblotted with anti-Rho antibodies. (i) The histograms illustrate densitometric analysis of the relative activity of Rho normalized for whole cell lysates and relative to control cells. Means ± SEM of six independent experiments are shown. #, Statistically significant versus Cav1−/− MEFs transfected with the empty vector.
Figure 8.
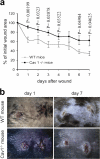
Wound healing in skin of WT and Cav1−/− mice. Two wounds were created per mouse in five Cav1−/− mice and five WT mice (n = 10). (a) The graph represents the percentage of initial wound area left at the indicated days after the punch was made (mean ± SEM). Statistical analysis shows that the healing rate is significantly different between genotypes 1–4, 6, and 7 d after wound creation (p-values). (b) Representative images of wounds 1 and 7 d after wound creation are shown.
Similar articles
- Caveolin-1 in cell polarization and directional migration.
Grande-García A, del Pozo MA. Grande-García A, et al. Eur J Cell Biol. 2008 Sep;87(8-9):641-7. doi: 10.1016/j.ejcb.2008.02.001. Epub 2008 Mar 28. Eur J Cell Biol. 2008. PMID: 18375013 Review. - Phosphorylated caveolin-1 regulates Rho/ROCK-dependent focal adhesion dynamics and tumor cell migration and invasion.
Joshi B, Strugnell SS, Goetz JG, Kojic LD, Cox ME, Griffith OL, Chan SK, Jones SJ, Leung SP, Masoudi H, Leung S, Wiseman SM, Nabi IR. Joshi B, et al. Cancer Res. 2008 Oct 15;68(20):8210-20. doi: 10.1158/0008-5472.CAN-08-0343. Cancer Res. 2008. PMID: 18922892 - In vitro assay of primary astrocyte migration as a tool to study Rho GTPase function in cell polarization.
Etienne-Manneville S. Etienne-Manneville S. Methods Enzymol. 2006;406:565-78. doi: 10.1016/S0076-6879(06)06044-7. Methods Enzymol. 2006. PMID: 16472688 - The membrane-anchored metalloproteinase regulator RECK stabilizes focal adhesions and anterior-posterior polarity in fibroblasts.
Morioka Y, Monypenny J, Matsuzaki T, Shi S, Alexander DB, Kitayama H, Noda M. Morioka Y, et al. Oncogene. 2009 Mar 19;28(11):1454-64. doi: 10.1038/onc.2008.486. Epub 2009 Jan 26. Oncogene. 2009. PMID: 19169281 - IQGAP1: a key regulator of adhesion and migration.
Noritake J, Watanabe T, Sato K, Wang S, Kaibuchi K. Noritake J, et al. J Cell Sci. 2005 May 15;118(Pt 10):2085-92. doi: 10.1242/jcs.02379. J Cell Sci. 2005. PMID: 15890984 Review.
Cited by
- Coronin-1C Protein and Caveolin Protein Provide Constitutive and Inducible Mechanisms of Rac1 Protein Trafficking.
Williamson RC, Cowell CAM, Reville T, Roper JA, Rendall TCS, Bass MD. Williamson RC, et al. J Biol Chem. 2015 Jun 19;290(25):15437-15449. doi: 10.1074/jbc.M115.640367. Epub 2015 Apr 29. J Biol Chem. 2015. PMID: 25925950 Free PMC article. - Artocarpin Targets Focal Adhesion Kinase-Dependent Epithelial to Mesenchymal Transition and Suppresses Migratory-Associated Integrins in Lung Cancer Cells.
Nonpanya N, Sanookpan K, Sriratanasak N, Vinayanuwattikun C, Wichadakul D, Sritularak B, Chanvorachote P. Nonpanya N, et al. Pharmaceutics. 2021 Apr 14;13(4):554. doi: 10.3390/pharmaceutics13040554. Pharmaceutics. 2021. PMID: 33920031 Free PMC article. - Reovirus uses multiple endocytic pathways for cell entry.
Schulz WL, Haj AK, Schiff LA. Schulz WL, et al. J Virol. 2012 Dec;86(23):12665-75. doi: 10.1128/JVI.01861-12. Epub 2012 Sep 12. J Virol. 2012. PMID: 22973022 Free PMC article. - Podosomes in migrating microglia: components and matrix degradation.
Vincent C, Siddiqui TA, Schlichter LC. Vincent C, et al. J Neuroinflammation. 2012 Aug 8;9:190. doi: 10.1186/1742-2094-9-190. J Neuroinflammation. 2012. PMID: 22873355 Free PMC article. - Caveolae as plasma membrane sensors, protectors and organizers.
Parton RG, del Pozo MA. Parton RG, et al. Nat Rev Mol Cell Biol. 2013 Feb;14(2):98-112. doi: 10.1038/nrm3512. Nat Rev Mol Cell Biol. 2013. PMID: 23340574 Review.
References
- Arthur, W.T., L.A. Petch, and K. Burridge. 2000. Integrin engagement suppresses RhoA activity via a c-Src-dependent mechanism. Curr. Biol. 10:719–722. - PubMed
- Beardsley, A., K. Fang, H. Mertz, V. Castranova, S. Friend, and J. Liu. 2005. Loss of caveolin-1 polarity impedes endothelial cell polarization and directional movement. J. Biol. Chem. 280:3541–3547. - PubMed
- Brouns, M.R., S.F. Matheson, and J. Settleman. 2001. p190 RhoGAP is the principal Src substrate in brain and regulates axon outgrowth, guidance and fasciculation. Nat. Cell Biol. 3:361–367. - PubMed
- Burridge, K., and K. Wennerberg. 2004. Rho and Rac take center stage. Cell. 116:167–179. - PubMed
Publication types
MeSH terms
Substances
LinkOut - more resources
Full Text Sources
Other Literature Sources
Molecular Biology Databases
Miscellaneous
