CD40 ligand and MHC class II expression are essential for human peripheral B cell tolerance - PubMed (original) (raw)
CD40 ligand and MHC class II expression are essential for human peripheral B cell tolerance
Maxime Hervé et al. J Exp Med. 2007.
Abstract
Hyper-IgM (HIGM) syndromes are primary immunodeficiencies characterized by defects of class switch recombination and somatic hypermutation. HIGM patients who carry mutations in the CD40-ligand (CD40L) gene expressed by CD4(+) T cells suffer from recurrent infections and often develop autoimmune disorders. To investigate the impact of CD40L-CD40 interactions on human B cell tolerance, we tested by ELISA the reactivity of recombinant antibodies isolated from single B cells from three CD40L-deficient patients. Antibody characteristics and reactivity from CD40L-deficient new emigrant B cells were similar to those from healthy donors, suggesting that CD40L-CD40 interactions do not regulate central B cell tolerance. In contrast, mature naive B cells from CD40L-deficient patients expressed a high proportion of autoreactive antibodies, including antinuclear antibodies. Thus, CD40L-CD40 interactions are essential for peripheral B cell tolerance. In addition, a patient with the bare lymphocyte syndrome who could not express MHC class II molecules failed to counterselect autoreactive mature naive B cells, suggesting that peripheral B cell tolerance also depends on major histocompatibility complex (MHC) class II-T cell receptor (TCR) interactions. The decreased frequency of MHC class II-restricted CD4(+) regulatory T cells in CD40L-deficient patients suggests that these T cells may mediate peripheral B cell tolerance through CD40L-CD40 and MHC class II-TCR interactions.
Figures
Figure 1.
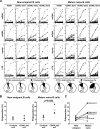
CD40L-deficient mature naive B cells express polyreactive antibodies. (A, top) Antibodies from new emigrant (left) and mature naive (right) B cells from a 14-yr-old HD (HD08) and three CD40L-deficient patients were tested in ELISA for reactivity with ssDNA, dsDNA, insulin, and LPS. Dashed lines show ED38-positive control (19, 54). Horizontal lines show cut-off OD405 for positive reactivity. (bottom) For each individual, the frequency of polyreactive (filled area) and nonpolyreactive (open area) clones is summarized in pie charts, with the number of antibodies tested indicated in the centers. (B) The frequency of polyreactive clones in the mature naive fraction of CD40L-deficient patients is higher than in healthy controls. The proportions of polyreactive B cells in new emigrant (left) and mature naive (right) B cells from five controls and three CD40L-deficient patients and (C) their evolution between these two B cell compartments are represented. Each diamond represents an individual, and the mean is shown with a bar. The controls shown include the two newly studied HD controls, HD08 and HD09, added to the previously reported controls (19, 21, 22). Statistically significant differences are indicated.
Figure 2.
CD40L-deficient mature naive B cells express HEp-2–reactive antibodies. (A, top) Antibodies from new emigrant (left) and mature naive (right) B cells from a young HD, HD08, and three CD40L-deficient patients were tested in ELISA for anti–HEp-2 cell reactivity. Dashed lines show ED38-positive control (19, 54). Horizontal lines show cut-off OD405 for positive reactivity. (bottom) For each individual, the frequency of HEp-2–reactive (filled area) and non–HEp-2-reactive (open area) clones is summarized in pie charts, with the number of antibodies tested indicated in the centers. (B) The frequency of HEp-2–reactive clones in the mature naive fraction of CD40L-deficient patients is higher than in controls. The proportions of HEp-2–reactive B cells in new emigrant (left) and mature naive (right) B cells from five controls and three CD40L-deficient patients, and (C) their evolution between these two B cell compartments are represented. Each diamond represents an individual, and the mean is shown with a bar. The controls shown include the two newly studied HD controls, HD08 and HD09, added to the previously reported controls (19, 21, 22). Statistically significant differences are indicated.
Figure 3.
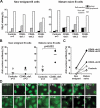
Mature naive B cells from CD40L-deficient patients express ANAs. (A) The frequency of self-reactive antibodies with nuclear (black bars) and cytoplasmic (gray bars) HEp-2 staining patterns, and the proportion of nonreactive antibodies (open bars) in new emigrant (right) and mature naive (left) B cells are shown for three controls and three CD40L-deficient patients. The data from three healthy controls (JH, HD08, and HD09) were pooled. (B) The frequency of ANA clones in the mature naive B cell compartment of CD40L-deficient patients is significantly higher than in healthy controls. The proportions of ANA-expressing B cells in new emigrant (left) and mature naive (right) B cells from controls and three CD40L-deficient patients and (C) their evolution between these two B cell compartments are represented. Each diamond represents an individual, and the mean is shown with a bar. The controls shown include the two newly studied HD controls, HD08 and HD09, added to the previously reported control (21). Statistically significant differences are indicated. (D) Antibodies from CD40L-deficient mature naive B cells show diverse antinuclear staining including homogeneous (1–92, 1–195, 2–45), speckled (3–57 and 3–146), nucleolar and cytoplasmic (1–172, 1–184, 1–188, 2–86, 3–28, and 3–140), and nucleolar only (1–17, 1–167, and 1–169).
Figure 4.
Mature naive B cells from a BLS patient express autoreactive antibodies. (A) A BLS patient showed decreased CD27+ memory B cells. Dot plots show CD27/IgM (top), CD10/CD27 (middle), and HLA-A,B,C/HLA-DR (bottom) expression on CD19+-gated B cells from a HD control HD09 (right) and a BLS patient. The BLS patient displayed decreased IgM−CD27+ class-switched and IgM+CD27+ memory B cell populations and an increased CD10+CD27+ new emigrant B cell population compared with HD controls. BLS B cells fail to express HLA-DR MHC class II molecules. (B) BLS B cells express polyreactive antibodies at a frequency similar to an age-matched control. Antibodies from new emigrant (left) and mature naive (right) B cells from a HD, HD09, and a BLS patient were tested in ELISA for reactivity with ssDNA, dsDNA, insulin, and LPS. Dashed lines show ED38-positive control (19, 54). Horizontal lines show cut-off OD405 for positive reactivity. For each individual, the frequency of polyreactive (filled area) and nonpolyreactive (open area) clones is summarized in pie charts, with the number of antibodies tested indicated in the centers. (C) BLS mature naive B cells express HEp-2–reactive antibodies. Antibodies from new emigrant (left) and mature naive (right) B cells from HD09 and a BLS patient were tested in ELISA for anti–HEp-2 cell reactivity. Dashed lines show ED38-positive control (19, 54). Horizontal lines show cut-off OD405 for positive reactivity. For each individual, the frequency of HEp-2–reactive (filled area) and non–HEp-2-reactive (open area) clones is summarized in pie charts, with the number of antibodies tested indicated in the centers.
Figure 5.
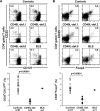
Low T reg cell frequency in CD40L-deficient patients. The frequency of T reg cells among peripheral CD4+ T cells was assessed by analyzing the proportion of CD25+CD127lo/− (A) and CD25+Foxp3+ (B) cells. Dot plots are shown for two healthy controls, three CD40L-deficient patients, and the BLS patient (top), and the data collected for controls (open diamonds) and patients (filled diamonds) are represented in the diagram. Each diamond represents an individual, and the mean is shown with a bar. The mean percentage of CD25+CD127lo/− cells among CD4+ T cells in HDs, 7.30 ± 1.6%; CD40L-deficient, 1.68 ± 0.5%; BLS, 6.4%; mean percentage of CD25+Foxp3+ cells among CD4+ T cells in HDs, 6.52 ± 0.9%; CD40L-deficient, 2.15 ± 0.6%; BLS, 5.8%. Statistically significant differences are indicated.
Figure 6.
Elevated serum BAFF levels in CD40L-deficient and BLS patients. BAFF concentrations (pg/ml) in the serum of HD controls (open diamonds), six CD40L-deficient patients, and the BLS patient (filled diamonds) were measured by ELISA. Each diamond represents an individual, and the mean is shown with a bar: HD controls, 1,164 ± 364 pg/ml; CD40L-deficient, 3,259 ± 1,155 pg/ml; BLS, 4,514 pg/ml. Statistically significant differences are indicated.
Similar articles
- Autoimmunity in hyper-IgM syndrome.
Jesus AA, Duarte AJ, Oliveira JB. Jesus AA, et al. J Clin Immunol. 2008 May;28 Suppl 1:S62-6. doi: 10.1007/s10875-008-9171-x. Epub 2008 Feb 2. J Clin Immunol. 2008. PMID: 18246414 Review. - Prospects for modulating the CD40/CD40L pathway in the therapy of the hyper-IgM syndrome.
Meng X, Yang B, Suen WC. Meng X, et al. Innate Immun. 2018 Jan;24(1):4-10. doi: 10.1177/1753425917739681. Epub 2017 Nov 13. Innate Immun. 2018. PMID: 29132233 Free PMC article. Review. - Human CD19 and CD40L deficiencies impair antibody selection and differentially affect somatic hypermutation.
van Zelm MC, Bartol SJ, Driessen GJ, Mascart F, Reisli I, Franco JL, Wolska-Kusnierz B, Kanegane H, Boon L, van Dongen JJ, van der Burg M. van Zelm MC, et al. J Allergy Clin Immunol. 2014 Jul;134(1):135-44. doi: 10.1016/j.jaci.2013.11.015. Epub 2014 Jan 11. J Allergy Clin Immunol. 2014. PMID: 24418477 - The role of CD40-CD40 ligand interactions in suppression of human B cell responsiveness by CD4+ T cells.
Hirohata S. Hirohata S. Cell Immunol. 1997 Nov 25;182(1):20-8. doi: 10.1006/cimm.1997.1209. Cell Immunol. 1997. PMID: 9427806
Cited by
- Autoreactive antibodies control blood glucose by regulating insulin homeostasis.
Amendt T, Allies G, Nicolò A, El Ayoubi O, Young M, Röszer T, Setz CS, Warnatz K, Jumaa H. Amendt T, et al. Proc Natl Acad Sci U S A. 2022 Feb 8;119(6):e2115695119. doi: 10.1073/pnas.2115695119. Proc Natl Acad Sci U S A. 2022. PMID: 35131852 Free PMC article. - Autoimmunity in primary immune deficiency: taking lessons from our patients.
Cunningham-Rundles C. Cunningham-Rundles C. Clin Exp Immunol. 2011 Jun;164 Suppl 2(Suppl 2):6-11. doi: 10.1111/j.1365-2249.2011.04388.x. Clin Exp Immunol. 2011. PMID: 21466546 Free PMC article. Review. - Dedicator of cytokinesis 8-deficient patients have a breakdown in peripheral B-cell tolerance and defective regulatory T cells.
Janssen E, Morbach H, Ullas S, Bannock JM, Massad C, Menard L, Barlan I, Lefranc G, Su H, Dasouki M, Al-Herz W, Keles S, Chatila T, Geha RS, Meffre E. Janssen E, et al. J Allergy Clin Immunol. 2014 Dec;134(6):1365-1374. doi: 10.1016/j.jaci.2014.07.042. Epub 2014 Sep 11. J Allergy Clin Immunol. 2014. PMID: 25218284 Free PMC article. - The PTPN22 allele encoding an R620W variant interferes with the removal of developing autoreactive B cells in humans.
Menard L, Saadoun D, Isnardi I, Ng YS, Meyers G, Massad C, Price C, Abraham C, Motaghedi R, Buckner JH, Gregersen PK, Meffre E. Menard L, et al. J Clin Invest. 2011 Sep;121(9):3635-44. doi: 10.1172/JCI45790. Epub 2011 Aug 1. J Clin Invest. 2011. PMID: 21804190 Free PMC article. - Proposed therapies in primary biliary cholangitis.
Floreani A, Sun Y, Zou ZS, Li B, Cazzagon N, Bowlus CL, Gershwin ME. Floreani A, et al. Expert Rev Gastroenterol Hepatol. 2016;10(3):371-382. doi: 10.1586/17474124.2016.1121810. Epub 2016 Jan 6. Expert Rev Gastroenterol Hepatol. 2016. PMID: 26577047 Free PMC article. Review.
References
- Winkelstein, J.A., M.C. Marino, H. Ochs, R. Fuleihan, P.R. Scholl, R. Geha, E.R. Stiehm, and M.E. Conley. 2003. The X-linked hyper-IgM syndrome: clinical and immunologic features of 79 patients. Medicine (Baltimore). 82:373–384. - PubMed
- Gulino, A.V., and L.D. Notarangelo. 2003. Hyper IgM syndromes. Curr. Opin. Rheumatol. 15:422–429. - PubMed
- Durandy, A., S. Peron, and A. Fischer. 2006. Hyper-IgM syndromes. Curr. Opin. Rheumatol. 18:369–376. - PubMed
- Korthauer, U., D. Graf, H.W. Mages, F. Briere, M. Padayachee, S. Malcolm, A.G. Ugazio, L.D. Notarangelo, R.J. Levinsky, and R.A. Kroczek. 1993. Defective expression of T-cell CD40 ligand causes X-linked immunodeficiency with hyper-IgM. Nature. 361:539–541. - PubMed
- Lee, W.I., T.R. Torgerson, M.J. Schumacher, L. Yel, Q. Zhu, and H.D. Ochs. 2005. Molecular analysis of a large cohort of patients with the hyper immunoglobulin M (IgM) syndrome. Blood. 105:1881–1890. - PubMed
Publication types
MeSH terms
Substances
Grants and funding
- HD 37091/HD/NICHD NIH HHS/United States
- AI 061093/AI/NIAID NIH HHS/United States
- R01 HD037091/HD/NICHD NIH HHS/United States
- C06 RR 12538-01/RR/NCRR NIH HHS/United States
- P01 AI061093/AI/NIAID NIH HHS/United States
- C06 RR012538/RR/NCRR NIH HHS/United States
LinkOut - more resources
Full Text Sources
Research Materials


