CDK8 is a stimulus-specific positive coregulator of p53 target genes - PubMed (original) (raw)
CDK8 is a stimulus-specific positive coregulator of p53 target genes
Aaron Joseph Donner et al. Mol Cell. 2007.
Abstract
The p53 transcriptional network orchestrates alternative stress responses such as cell-cycle arrest and apoptosis. Here we investigate the mechanism of differential expression of p21, a key mediator of p53-dependent cell-cycle arrest. We demonstrate that the transcriptional activity of the p21 promoter varies greatly in response to distinct p53-activating stimuli. Chromatin immunoprecipitation analysis of the p21 locus indicates that histone acetyltransferases, general transcription factors, and Mediator subunits are assembled into alternative transcriptional complexes of different activity. Interestingly, core Mediator subunits MED1 and MED17 are recruited to the p21 locus regardless of the p53-activating stimuli utilized. In contrast, three subunits of the CDK module of Mediator (CDK8, MED12, and cyclin C) are exclusively recruited during conditions of strong p21 transcriptional activation. Furthermore, increased binding of CDK8 to p53 target genes correlates positively with transcriptional strength. RNAi experiments demonstrate that CDK8 functions as a coactivator within the p53 transcriptional program.
Figures
Figure 1. Differential Expression of p21 during Stimulus-Specific Responses to p53 Activation
(A) Cell-cycle profiles of HCT116 cells 24 hr posttreatment with UVC (25 J/m2) or Nutlin 3 (10 µM) were determined by FACS analysis of DNA content. Pie charts show the percentage of cells in each phase of the cell cycle. (B) Western blot analysis of HCT116+/+ cells at the indicated times following treatment with UVC or Nutlin 3 showing accumulation of total p53, phospho-Ser15 p53 (S15P-p53), and p21. (C) Real-time PCR analysis of p21 and Btg2 mRNA induction following UVC and Nutlin 3 treatment expressed as fold induction over untreated cells after normalization to 18S rRNA levels. Error bars represent the standard deviation.
Figure 2. Stimulus-Specific RNAP II Activation at the p21 Locus
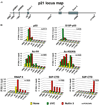
(A) Schematic of the p21 locus indicating the two p53 binding sites (high-affinity p53BS1 and low-affinity p53BS2) and overall gene structure. Amplicons used in real-time PCR quantification of ChIP-enriched DNA are named according to their relative distance (bp) to the transcription start site. (B) ChIP analysis was carried out using protein extracts of untreated and UVC- or Nutlin-treated cells (8 hr) using antibodies against total p53 (p53), phospho-Ser15 p53 (S15P-p53), acetylated histone H4 (Ac-H4), acetylated histone H3 (Ac-H3[K9]), total RNAP II, and phosphorylated Ser5 and Ser2 forms of RNAP II (S5P-CTD and S2P-CTD). Numbers of PCR and ChIP replicates are indicated. Standard deviation is below 20%.
Figure 3. Stimulus-Specific Recruitment of the CDK Module of Mediator to the p21 Locus
ChIP analysis was carried out as in Figure 2 using antibodies against TFIIA-γ (TFIIA), TFIIB, RAP74 (TFIIF), MED17, MED1, CDK8, MED12, and cyclin C. Numbers of PCR and ChIP replicates are indicated. Standard deviation is below 20%.
Figure 4. Differential p21 Expression and Stimulus-Specific Recruitment of CDK8 Are Conserved in SJSA-1 Cells
(A) Western blot analysis of p53 and p21 induction in SJSA-1 cells 8 hr following treatment with UVC (50 J/m2) and Nutlin 3 (30 µM). (B) Real-time PCR analysis of p21 and Btg2 mRNA induction at 8 and 16 hr following UVC and Nutlin 3 treatment expressed as fold induction over untreated cells and normalized to 18S ribosomal RNA levels. Error bars represent the standard deviation. (C) ChIP analysis of the p21 locus was performed as in Figure 2 using antibodies against total p53 (p53), phosphorylated Ser-2 isoform of RNAP II (S2P-CTD), MED1, and CDK8. Numbers of PCR and ChIP replicates are indicated. Standard deviation is below 20%.
Figure 5. Recruitment of CDK8 to the p21 Locus during Activation by Distinct Stimuli
(A) Western blot analysis of HCT116 p53+/+ cells 16 hr following treatment with IR (10 Gy), 5-fluorouracil (5-FU, 375 µM), and doxorubicin (Dox, 0.5 µM) showing accumulation of total p53 (p53), phospho-Ser15 p53 (S15P-p53), and p21. (B) Real-time PCR analysis of p21 mRNA induction at the given times following IR, 5-FU, and doxorubicin treatment. Data is expressed as fold induction over untreated cells and normalized to 18S ribosomal RNA levels. Error bars represent the standard deviation. (C) ChIP analysis of the p21 locus was performed as in Figure 2 using antibodies against total p53 (p53), phosphorylated Ser-2 isoform of RNAP II (S2P-CTD), and CDK8. Numbers of PCR and ChIP replicates are indicated. Standard deviation is below 20%.
Figure 6. CDK8 Recruitment Positively Correlates with Transcriptional Activation of p53 Target Genes
(A) High-density ChIP tiling of CDK8, RNAP II, and NELF-A at the p21 locus before and after Nutlin 3 treatment (8 hr) of HCT116+/+ cells. Significance of higher CDK8 occupancy at each intragenic amplicon (blue labels) relative to the control region +11443 (arrow) is indicated by asterisks (p values). (B) Real-time PCR analysis of Hdm2, Fas, and p53dinp1 mRNA induction by Nutlin 3 treatment (16 hr) in HCT116+/+ and HCT116−/− cells expressed as fold induction over untreated cells and normalized to 18S ribosomal RNA levels. Error bars represent the standard deviation. (C) ChIP analysis of RNAP II, phospho-Ser2 RNAP II (S2P-CTD), CDK8, and MED1 at the core promoter (5′) and the last exon (3′) of the Hdm2, Fas, and p53dinp1 genes before and after Nutlin treatment (8 hr). Numbers of PCR and ChIP replicates are indicated. Standard deviation is below 20%.
Figure 7. CDK8 Acts as a Positive Regulator of p53-Dependent p21 and Hdm2 Expression
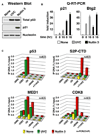
(A) Western blot analysis of untreated and Nutlin 3-treated (16 hr) HCT116+/+ cells following knockdown of CDK8. (B) Real-time PCR analysis of p21 and Hdm2 mRNA induction in cells transfected with control of CDK8-specific siRNA. Data is expressed as fold induction over untreated cells and normalized to 18S ribosomal RNA levels. Error bars represent the standard deviation. (C) p21 and Hdm2 reporter assays in Saos-2 cells transfected with p53, CDK8, and cyclin C expression vectors as noted. Normalized values are shown as fold induction relative to empty vector alone. Error bars represent the standard deviation.
References
- Akoulitchev S, Chuikov S, Reinberg D. TFIIH is negatively regulated by cdk8-containing mediator complexes. Nature. 2000;407:102–106. - PubMed
- An W, Kim J, Roeder RG. Ordered cooperative functions of PRMT1, p300, and CARM1 in transcriptional activation by p53. Cell. 2004;117:735–748. - PubMed
- Bendjennat M, Boulaire J, Jascur T, Brickner H, Barbier V, Sarasin A, Fotedar A, Fotedar R. UV irradiation triggers ubiquitin-dependent degradation of p21(WAF1) to promote DNA repair. Cell. 2003;114:599–610. - PubMed
Publication types
MeSH terms
Substances
LinkOut - more resources
Full Text Sources
Other Literature Sources
Research Materials
Miscellaneous


