MUC1 cell surface mucin is a critical element of the mucosal barrier to infection - PubMed (original) (raw)
Comparative Study
. 2007 Aug;117(8):2313-24.
doi: 10.1172/JCI26705.
Affiliations
- PMID: 17641781
- PMCID: PMC1913485
- DOI: 10.1172/JCI26705
Comparative Study
MUC1 cell surface mucin is a critical element of the mucosal barrier to infection
Julie L McAuley et al. J Clin Invest. 2007 Aug.
Abstract
Cell surface mucin glycoproteins are highly expressed by all mucosal tissues, yet their physiological role is currently unknown. We hypothesized that cell surface mucins protect mucosal cells from infection. A rapid progressive increase in gastrointestinal expression of mucin 1 (Muc1) cell surface mucin followed infection of mice with the bacterial pathogen Campylobacter jejuni. In the first week following oral infection, C. jejuni was detected in the systemic organs of the vast majority of Muc1(-/-) mice but never in Muc1(+/+) mice. Although C. jejuni entered gastrointestinal epithelial cells of both Muc1(-/-) and Muc1(+/+) mice, small intestinal damage as manifested by increased apoptosis and enucleated and shed villous epithelium was more common in Muc1(-/-) mice. Using radiation chimeras, we determined that prevention of systemic infection in wild-type mice was due exclusively to epithelial Muc1 rather than Muc1 on hematopoietic cells. Expression of MUC1-enhanced resistance to C. jejuni cytolethal distending toxin (CDT) in vitro and CDT null C. jejuni showed lower gastric colonization in Muc1(-/-) mice in vivo. We believe this is the first in vivo experimental study to demonstrate that cell surface mucins are a critical component of mucosal defence and that the study provides the foundation for exploration of their contribution to epithelial infectious and inflammatory diseases.
Figures
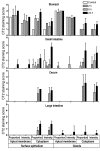
Figure 1. Gastrointestinal expression of Muc1 is rapidly upregulated in response to infection with C. jejuni.
Muc1 expression was determined by immunohistochemistry with the CT2 cytoplasmic domain antibody in the stomach, small intestine, and large intestine of uninfected Muc1+/+ mice (control) and mice infected with 104 C. jejuni for 2, 6, and 24 hours. Scoring of the proportion of cells staining and the staining intensity for deep glands or the surface epithelium (villous epithelium in the small intestine) was performed blind to treatment. Examples of staining at each time point are provided in Supplemental Figure 1. No staining was seen in uninfected or infected Muc1–/– mice.
Figure 2. C. jejuni adheres to murine intestinal mucins and the H type 2 oligosaccharide and binds more rapidly to MUC1-expressing cells.
ELISA results showing (A) binding of C. jejuni strain 81116 to mucin purified from murine small intestine and BSA (control for nonspecific binding) at pH 7.2 and 6.0 and (B) binding at pH 7.2–5.0 both without (control) and with prior desialylation of mucin with neuraminidase. (C) Binding of mucin oligosaccharides conjugated to FITC-labeled human serum albumin to C. jejuni. Fluorescence units are shown after deducting mean background autofluorescence of the C. jejuni alone. sLex, sialyl-Lex; H2, H type 2. (D) MUC1 expression determined by flow cytometry in 2 independent stable clones established from HCT116 intestinal cancer cells transfected with MUC1 (MUC1.A and MUC1.B) and 2 independent stable clones from the pcDNA3 vector (Vector.A and Vector.B) (shaded area is negative control antibody; dark line is BC2 antibody reactive with the extracellular domain of MUC1). Clones were cocultured with 106 C. jejuni per well for 1 or 2 hours under microaerophilic conditions. Adhesion of C. jejuni was determined at 1 and 2 hours, and invasion was determined at 2 hours only. Mean ± SD is shown. (A) ***P < 0.001 versus BSA; ###P < 0.001 versus pH 7.2; (B) *P < 0.05; **P < 0.01 versus control; (C) ***P < 0.001 versus albumin-FITC; ANOVA and Tukey’s post-hoc test were used. (D) Box plots showing medians, quartiles, and ranges are shown.
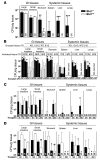
Figure 3. Muc1–/– mice are more susceptible to systemic infection by C. jejuni.
Concentrations of C. jejuni in homogenized gastrointestinal and systemic tissues of Muc1–/– and Muc1+/+ 129/SvJ mice after oral inoculation with C. jejuni strain 81116. Mean ± SD of CFUs/g tissue. The colonization frequency (number of animals from which colonies were obtained/total number in the group) is shown at the base of each histogram (A, C, and D) or as pooled data for tissues and tissue types (B). (A) Six days after inoculation with 108 bacteria. (B) Four days after inoculation with 106, 104, 103, and 102 bacteria. (C) Two, 6, and 24 hours after inoculation with 104 bacteria. (D) Fourteen and 28 days after inoculation with 103 bacteria. (A and D) ANOVA, Tukey’s post-hoc test; (B and C) Mann-Whitney U test. *P < 0.05, Muc1–/– versus Muc1+/+; #P < 0.05, 14 days versus 28 days; **P < 0.01, Muc1–/– versus Muc1+/+; ##P < 0.01, 14 days versus 28 days; ***P < 0.001. C. jejuni was not detected in uninfected Muc1–/– and Muc1+/+ mice (not shown). GI, gastrointestinal.
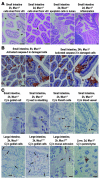
Figure 4. Epithelial damage and apoptosis and localization of bacteria in the gastrointestinal epithelium of _C. jejuni_–infected Muc1–/– and Muc1+/+ mice.
Tissue type, mouse genotype, time after inoculation, and a summary of the features demonstrated are shown above each photomicrograph. (A) H&E staining; arrows show shed epithelial cells. Immunohistochemical detection counterstained with hematoxylin of (B) activated caspase-3 and (C) C. jejuni (Cj). Arrows indicate the presence of C. jejuni. Scale bars: 50 μm (A and B); white scale bars: 20 μm (C); black scale bars: 10 μm (C).
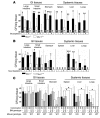
Figure 5. Rapid systemic infection with C. jejuni in Muc1–/– mice is not due to a hematopoietic deficiency in Muc1.
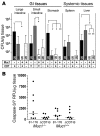
Concentrations of C. jejuni in gastrointestinal and systemic tissues of macrophage-depleted (A), neutrophil-depleted (B), and control Muc1–/– and Muc1+/+ 129/SvJ mice 2 days after oral inoculation with 104 C. jejuni strain 81116. Neutrophil depletion was confirmed by flow cytometry on peripheral blood (not shown). Mean ± SD of CFUs/g tissue. Colonization frequency is shown at the base of each histogram. ANOVA, Tukey’s post-hoc test; *P < 0.05, Muc1–/– versus Muc1+/+; **P < 0.01, Muc1–/– versus Muc1+/+; ##P < 0.01, phagocyte-depleted versus control; ***P < 0.001, Muc1–/– versus Muc1+/+. Mφ, macrophage; Neut, neutrophil. (C) Concentrations of C. jejuni in gastrointestinal and systemic tissues from KO and Muc1+/+ (WT) mice infected 6 months after lethal irradiation and transplantation of bone marrow from Muc1–/– (KO) and Muc1+/+ (WT) mice and in nontransplanted (–) control mice of the same age. Mean ± SD CFUs/g tissue 2 days after oral inoculation with 104 C. jejuni. Colonization frequency is shown at the base of each histogram. ANOVA, Tukey’s post-hoc test; *P < 0.05, Muc1–/– versus Muc1+/+.
Figure 6. Reduced bacterial flora increases susceptibility of Muc1+/+ mice to C. jejuni infection, but bacterial flora is not altered in Muc1–/– mice.
(A) Concentrations of C. jejuni in gastrointestinal and systemic tissues of Muc1–/– and Muc1+/+ 129/SvJ mice after oral inoculation with 105 C. jejuni strain 81116 with (+) and without (–) treatment with broad spectrum oral antibiotics for 7 days. Antibiotics were withdrawn 24 hours prior to inoculation. Mean ± SD of CFUs/g tissue. Colonization frequency is shown at the base of each histogram. ANOVA, Tukey’s post-hoc test; *P < 0.05, Muc1–/– versus Muc1+/+; ***P < 0.001, Muc1–/– versus Muc1+/+; †P < 0.001, antibiotics versus control. (B) Number of bacteria in the entire large intestine was estimated by counting SYBR green–stained bacteria on filtered fixed tissue homogenates. DNA was extracted from feces of Muc1–/– and Muc1+/+ mice and quantitative PCR used to amplify 16S ribosomal DNA and quantify the abundance of major intestinal bacterial groups. BPP, _Bacteroides_-_Prevotella_-Porphyromonas group; Ccoc, C. coccoides group; Entero, Enterococcus spp; Lacto, Lactobacillus group; Desulfo, Desulfovibrio group; Clep, C. leptum subgroup; Bifido, Bifidobacterium genus. Results in individual mice were expressed as a proportion of the result for universal bacterial 16S ribosomal DNA primers. Box plots show medians, quartiles, and ranges.
Figure 7. MUC1 protects epithelial cells from the C. jejuni CDT.
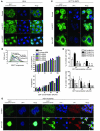
(A) HeLa cells were exposed to 200 AU/ml CDT for 0, 6, or 24 hours. MUC1 extracellular domain and nuclei were stained and examined by confocal microscopy. (B) MUC1 expression in HeLa cervical cancer cells stably expressing 2 differing MUC1 shRNAs (M1.3, M1.4, 2 cultures, A and B, for each shRNA) or a control (luciferase) shRNA were determined by flow cytometry (shaded area represents control antibody; lines show MUC1 staining); percentage decrease in median fluorescence in parentheses. Parent cells and the sublines were exposed to 16–100 AU/ml of CDT for 48 hours. The proportion of cells in the S/G2+M phases of the cell cycle and the percentage of cells in apoptosis (annexin V–positive) were determined by flow cytometry. (C) The EM10 MUC1–expressing clone of HCT116 cells was exposed to 200 AU/ml CDT for 0, 6, or 24 hours and stained as in A. (D) Stable clones of HCT116 cells transfected with MUC1 or the pcDNA3 vector (see MUC1 expression in Figure 2D) were exposed to CDT for 96 hours, and cells were counted and expressed as a proportion of control vehicle–only treated cultures. Two distinct experiments are shown. ANOVA, Tukey’s post-hoc test; *P < 0.05 versus HCT116.MUC1.A; #P < 0.05 versus HCT116.MUC1.B; **P < 0.01 versus HCT116.MUC1.A; ##P < 0.01 versus HCT116.MUC1.B; ***P < 0.001 versus HCT116.MUC1.A; ###P < 0.001 versus HCT116.MUC1.B. (E) The EM10 MUC1–expressing clone of HCT116 cells was exposed to 200 AU/ml CDT for 0 or 24 hours. MUC1 cytoplasmic domain, p53, and nuclei were stained and examined by confocal microscopy; arrows highlight colocalization of MUC1 and p53 in cytoplasmic vesicles.
Figure 8. ΔCDT-B C. jejuni show lower gastric colonization and lower intestinal apoptosis but equivalent penetration of the intestinal barrier in Muc1–/– mice in vivo.
(A) Concentrations of C. jejuni in gastrointestinal and systemic tissues of Muc1–/– (–) and Muc1+/+ (+) 129/SvJ mice 48 hours after oral inoculation with 105 C. jejuni strain 81-176 (CDT +) and ΔCDT-B (CDT –). Mean ± SEM of CFUs/g tissue. Colonization frequency is shown at the base of each histogram. ANOVA, Tukey’s post-hoc test; *P < 0.05; **P < 0.01. (B) Concentrations of activated apoptosis-associated caspases 3 and 7 determined by the Caspase-Glo 3/7 luminescence assay in 2 pooled 5-mm segments of the terminal ileum of mice in the experiment described in A. A linear scale is used because individual samples showed dilution linearity. RFU, relative fluorescence units.
Similar articles
- Muc1 mucin limits both Helicobacter pylori colonization of the murine gastric mucosa and associated gastritis.
McGuckin MA, Every AL, Skene CD, Linden SK, Chionh YT, Swierczak A, McAuley J, Harbour S, Kaparakis M, Ferrero R, Sutton P. McGuckin MA, et al. Gastroenterology. 2007 Oct;133(4):1210-8. doi: 10.1053/j.gastro.2007.07.003. Epub 2007 Jul 10. Gastroenterology. 2007. PMID: 17919495 - Muc1 limits Helicobacter felis binding to gastric epithelial cells but does not limit colonization and gastric pathology following infection.
Every AL, Chionh YT, Skene CD, McGuckin MA, Sutton P. Every AL, et al. Helicobacter. 2008 Dec;13(6):489-93. doi: 10.1111/j.1523-5378.2008.00644.x. Helicobacter. 2008. PMID: 19166413 - Reduced mucin sulfonation and impaired intestinal barrier function in the hyposulfataemic NaS1 null mouse.
Dawson PA, Huxley S, Gardiner B, Tran T, McAuley JL, Grimmond S, McGuckin MA, Markovich D. Dawson PA, et al. Gut. 2009 Jul;58(7):910-9. doi: 10.1136/gut.2007.147595. Epub 2009 Feb 6. Gut. 2009. PMID: 19201772 - Microbial-epithelial cell crosstalk during inflammation: the host response.
Kagnoff MF. Kagnoff MF. Ann N Y Acad Sci. 2006 Aug;1072:313-20. doi: 10.1196/annals.1326.038. Ann N Y Acad Sci. 2006. PMID: 17057211 Review. - The Role of the Cell Surface Mucin MUC1 as a Barrier to Infection and Regulator of Inflammation.
Dhar P, McAuley J. Dhar P, et al. Front Cell Infect Microbiol. 2019 Apr 24;9:117. doi: 10.3389/fcimb.2019.00117. eCollection 2019. Front Cell Infect Microbiol. 2019. PMID: 31069176 Free PMC article. Review.
Cited by
- Lung bronchiectasisas a paradigm of the interplay between infection and colonization on plastic modulation of the pre-metastatic niche.
Pisanu L, Mucaj K, Conio V, Bertuccio F, Giana I, Arlando L, Russo M, Montini S, Bortolotto C, Corsico AG, Stella GM. Pisanu L, et al. Front Oncol. 2024 Oct 14;14:1480777. doi: 10.3389/fonc.2024.1480777. eCollection 2024. Front Oncol. 2024. PMID: 39469649 Free PMC article. - Targeted disruption of core 1 β1,3-galactosyltransferase (C1galt1) induces apical endocytic trafficking in human corneal keratinocytes.
Guzman-Aranguez A, Woodward AM, Pintor J, Argüeso P. Guzman-Aranguez A, et al. PLoS One. 2012;7(5):e36628. doi: 10.1371/journal.pone.0036628. Epub 2012 May 4. PLoS One. 2012. PMID: 22574202 Free PMC article. - Investigation of motility and biofilm formation by intestinal Campylobacter concisus strains.
Lavrencic P, Kaakoush NO, Huinao KD, Kain N, Mitchell HM. Lavrencic P, et al. Gut Pathog. 2012 Dec 14;4(1):22. doi: 10.1186/1757-4749-4-22. Gut Pathog. 2012. PMID: 23241133 Free PMC article. - Smoking-associated increase in mucins 1 and 4 in human airways.
Merikallio H, Kaarteenaho R, Lindén S, Padra M, Karimi R, Li CX, Lappi-Blanco E, Wheelock ÅM, Sköld MC. Merikallio H, et al. Respir Res. 2020 Sep 18;21(1):239. doi: 10.1186/s12931-020-01498-7. Respir Res. 2020. PMID: 32948202 Free PMC article. Clinical Trial. - Crosstalk between MicroRNAs and Oxidative Stress in Coeliac Disease.
Pelizzaro F, Cardin R, Sarasini G, Minotto M, Carlotto C, Fassan M, Palo M, Farinati F, Zingone F. Pelizzaro F, et al. Inflamm Intest Dis. 2024 Jan 24;9(1):11-21. doi: 10.1159/000536107. eCollection 2024 Jan-Dec. Inflamm Intest Dis. 2024. PMID: 38298886 Free PMC article. Review.
References
- Dekker J., Rossen J.W., Buller H.A., Einerhand A.W. The MUC family: an obituary. Trends Biochem. Sci. 2002;27:126–131. - PubMed
- Linden S., et al. Strain- and blood group-dependent binding of Helicobacter pylori to human gastric MUC5AC glycoforms. Gastroenterology. 2002;123:1923–1930. - PubMed
- Mukherjee P., Tinder T.L., Basu G.D., Gendler S.J. MUC1 (CD227) interacts with lck tyrosine kinase in Jurkat lymphoma cells and normal T cells. J. Leukoc. Biol. 2005;77:90–99. - PubMed
- Lillehoj E.P., Kim H., Chun E.Y., Kim K.C. Pseudomonas aeruginosa stimulates phosphorylation of the airway epithelial membrane glycoprotein Muc1 and activates MAP kinase. Am. J. Physiol. Lung Cell. Mol. Physiol. 2004;287:L809–L815. - PubMed
- Wang H., Lillehoj E.P., Kim K.C. MUC1 tyrosine phosphorylation activates the extracellular signal-regulated kinase. Biochem. Biophys. Res. Commun. 2004;321:448–454. - PubMed
Publication types
MeSH terms
Substances
LinkOut - more resources
Full Text Sources
Other Literature Sources
Medical
Molecular Biology Databases
Research Materials
Miscellaneous
