Assembly of regulatory factors on rRNA and ribosomal protein genes in Saccharomyces cerevisiae - PubMed (original) (raw)
Assembly of regulatory factors on rRNA and ribosomal protein genes in Saccharomyces cerevisiae
Koji Kasahara et al. Mol Cell Biol. 2007 Oct.
Abstract
HMO1 is a high-mobility group B protein that plays a role in transcription of genes encoding rRNA and ribosomal proteins (RPGs) in Saccharomyces cerevisiae. This study uses genome-wide chromatin immunoprecipitation to study the roles of HMO1, FHL1, and RAP1 in transcription of these genes as well as other RNA polymerase II-transcribed genes in yeast. The results show that HMO1 associates with the 35S rRNA gene in an RNA polymerase I-dependent manner and that RPG promoters (138 in total) can be classified into several distinct groups based on HMO1 abundance at the promoter and the HMO1 dependence of FHL1 and/or RAP1 binding to the promoter. FHL1, a key regulator of RPGs, binds to most of the HMO1-enriched and transcriptionally HMO1-dependent RPG promoters in an HMO1-dependent manner, whereas it binds to HMO1-limited RPG promoters in an HMO1-independent manner, irrespective of whether they are transcribed in an HMO1-dependent manner. Reporter gene assays indicate that these functional properties are determined by the promoter sequence.
Figures
FIG. 1.
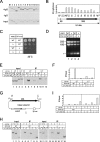
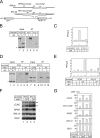
HMO1 associates throughout the 35S rRNA gene in a Pol I-dependent manner. (A) In vivo binding of HMO1 to various regions of the rRNA gene was analyzed by ChIP assays. The yeast strain expressing the TAP-tagged HMO1 (YKK74) was grown in YPD (yeast extract, peptone, dextrose) medium to mid-log phase at 30°C. Cross-linked chromatin from this strain was prepared and precipitated with either immunoglobulin G (IgG)-Sepharose 6 FastFlow (+IgG) or Sepharose 6 FastFlow (−IgG; negative control) beads. After the reversal of the cross-linking, PCR was performed to test for the presence of DNA corresponding to regions 1 to 14 (indicated schematically in panel B). The PCR products were separated by 5% polyacrylamide gel electrophoresis and stained with SYBR Green I. The top, middle, and bottom (input DNA) panels indicate the results of the PCR conducted for the chromatin after precipitation with or without IgG, or before precipitation, respectively. (B) The quantification of the raw data shown in panel A. The signals corresponding to each band were quantified by an image analyzer. The ratio of the IgG-precipitated signal (IP) to the input signal was calculated for the regions 1 to 14. 4/P and 14/T regions are overlapped with the promoter (P) and terminator (T) of the 35S RNA gene, respectively. (C) The effect of Δ_hmo1_ and/or Δ_rpa135_ on the growth of the yeast cells. The Δ_rpa135_ and Δ_hmo1_ Δ_rpa135_ strains carrying the plasmid pM5032 (encoding RPA135) were designated HMO1 RPA135 (YKK69) and Δ_hmo1 RPA135_ (YKK70), respectively. Similarly, the Δ_rpa135_ and Δ_hmo1_ Δ_rpa135_ strains carrying the helper plasmid pM5057 expressing 35S rRNA from the TEF1 promoter (schematically indicated in panel G) were designated HMO1 Δ_rpa135_ (YKK72) and Δ_hmo1_ Δ_rpa135_ (YKK100), respectively. These four strains were spotted onto YPD plates at three dilutions and grown at 30°C for 5 days. (D) The strains described in panel C were grown in YPD medium to mid-log phase at 30°C and total RNA was obtained from 1 × 10⁷ cells, then separated by 1% agarose gel electrophoresis and stained with ethidium bromide. The positions of 25S and 18S rRNA are indicated on the left. The asterisk may correspond to 5S/5.8S rRNA and tRNA. Further analyses on this band were described in Fig. S1 in the supplemental material. (E) In vivo binding of HMO1 to the promoter (4/P) and terminator (14/T) regions of the chromosomal 35S rRNA gene were analyzed by ChIP assays in the HMO1 RPA135 (YTK8866, indicated as WT) and HMO1 Δ_rpa135_ (YTK8867, indicated as Δ) strains expressing the FLAG-tagged HMO1. The strains were grown in synthetic complete (SC) medium to mid-log phase at 25°C. The cross-linked chromatin was prepared and precipitated with (+) or without (−) anti-FLAG monoclonal antibodies. After reversal of the cross-linking, PCR was performed and analyzed as described in panel A to test for the presence of DNA corresponding to the regions of 4/P and 14/T, both of which are modified (thereby were not contained) in the helper plasmid as shown in panels B and G. Left panel (input) shows the results of the PCR conducted on the chromatin before precipitation. (F) The quantification of the raw data shown in panel E. The signals corresponding to each band were quantified by an image analyzer. The ratio of the precipitated signal (IP) to the input signal was calculated for the regions 4/P and 14/T. (G) A schematic diagram of the helper plasmid pM5057. The regions that were amplified by PCR in the ChIP assays (H and I) are indicated as P, T, and I. (H) In vivo binding of HMO1 to the promoter (P), terminator (T) and unrelated intermediate (I) regions of the 35S rRNA gene on the helper plasmid were analyzed by ChIP assays using the same DNA fractions (input and IP) as described in panel E. (I) The quantification of the raw data shown in panel H was performed as described in panel F. WT, wild type.
FIG. 2.
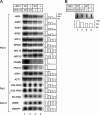
The effect of Δ_hmo1_ and/or Δ_rpa135_ on the transcription of the class II genes. (A) The expression of HIS4, ADE2, ADE3, RPS5, RPL3, RPS31, RPL10, HSP12, PHO84, PHO12, ADH1, ACT1, 25S rRNA, 5.8S rRNA, 5S rRNA, SNR6, and tRNAArg were measured by Northern blot analysis in the same strains as described in the legend of Fig. 1C. Total RNA was prepared and separated on the gel as described in the legend of Fig. 1D. Subsequently, the RNA was blotted onto the membrane and hybridized with the gene-specific probes indicated to the left of the image. The raw data (left panel) were quantified and are presented graphically in the right panel. Values for each transcript were normalized to the maximum expression of that transcript. (B) The effect of Δ_hmo1_ and/or Δ_rpa135_ on total poly(A)+ RNA levels. A slot blot of total RNA was hybridized with a radioactive oligo(dT) probe, and the quantified data are summarized in the lower panel, as described in panel A. WT, wild type.
FIG. 3.
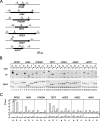
The in vivo binding of HMO1 with several class II genes. (A) Schematic diagrams of the amplified regions (a, b, c, and d) of RPS5, HIS4, PHO84, TEF2, ADE3, ADE2, and ADH1 genes by ChIP assays conducted as described in for panel B. (B) The raw data of the ChIP assays. The strains expressing the TAP-tagged HMO1 (YKK74) or the untagged HMO1 (Y13.2) were grown in YPD (yeast extract, peptone, dextrose) medium to mid-log phase at 30°C. The cross-linked chromatin from the former (even-numbered lanes; +) or the latter (odd-numbered lanes; −) strains were prepared and precipitated using immunoglobulin G-Sepharose. After the reversal of the cross-linking, PCR was performed and analyzed as described in the legend of Fig. 1A to test for the presence of DNA corresponding to the regions that are summarized in panel A. Each PCR contained a second primer pair that amplified a region (188 bp) of chromosome V that is devoid of ORFs, thus providing an internal background control (asterisk). The lower and upper panels show the results of the PCR conducted with the chromatin before (input) or after immunoprecipitation (IP), respectively. (C) The quantification of the raw data shown in panel B. The signals corresponding to each band were quantified by an image analyzer, after staining with SYBR Green I. The ratio of the precipitated signal (IP) to the input signal derived from the lysates containing the TAP-tagged (gray bar) or untagged (open bar) HMO1 was calculated for the genes indicated (upper panel) and a control region of chromosome V (lower panel, asterisk).
FIG. 4.
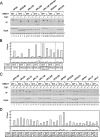
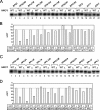
The in vivo binding of HMO1 with various RPG promoters. (A) The ChIP assays were conducted as described in the legend of Fig. 3 except that the primer pairs to amplify the RPG promoters indicated above the panel were used. The RPGs tested here were grouped into two types, the HMO1-enriched (left panel) or the HMO1-limited (right panel) RPGs, according to the signal intensity. (B) The quantification of the raw data shown in panel A was performed as described in the legend of Fig. 3C. IP, immunoprecipitate.
FIG. 5.
The effect of Δ_hmo1_ on the binding of FHL1 with various RPG promoters. (A) The in vivo FHL1 binding to HMO1-enriched RPG promoters described above the panel were investigated by ChIP assays. The HMO1 strains expressing the TAP-tagged (YTK8436) or untagged FHL1 (YTK8434) and the Δ_hmo1_ strains expressing the TAP-tagged (YTK8443) or untagged FHL1 (YTK8439) were grown in YPD (yeast extract, peptone, dextrose) medium to mid-log phase at 30°C. The ChIP assays were conducted as described in the legend of Fig. 3. The primer pairs were the same as described in the legend of Fig. 4A. (B) The quantification of the raw data shown in panel A was performed as described in the legend of Fig. 3C. (C) The in vivo FHL1 binding to HMO1-limited RPG promoters described above the panel were investigated by ChIP assays using the same DNA fractions (input and immunoprecipitate [IP]) as described in panel A. (D) The quantification of the raw data shown in panel C was performed as described in the legend of Fig. 3C. WT, wild type.
FIG. 6.
The effect of Δ_hmo1_ on the transcription of various RPGs. (A) The expression of the HMO-enriched RPG promoters and a few of the non-RP (i.e., TEF2, ACT1, and ADH1) gene promoters was measured by Northern blot analysis. The HMO1 (H2450) or Δ_hmo1_ (YTK8276) strains were grown in YPD (yeast extract, peptone, dextrose) medium to mid-log phase at 25°C. Total RNA was prepared and separated on the gel and hybridized with the gene-specific probes as described in the legend of Fig. 2A. (B) The quantification of the raw data shown in panel A was performed as described in the legend of Fig. 2A. The values for each transcript that were obtained from the Δ_hmo1_ strain were normalized to that the value of the transcript obtained from the HMO1 strain. (C) The expression of the HMO-limited RPG promoters was measured by Northern blot analysis as described for panel A. (D) The quantification of the raw data shown in panel C was performed as described for panel B. WT, wild type.
FIG. 7.
The HMO1 abundance at and the HMO1 dependence of FHL1 binding to the RPS5 and RPL10 promoters and the HMO1 dependence of the transcription of the RPS5 and RPL10 promoters were determined by the promoter sequences. (A) A schematic diagram of the mini-CLN2 reporter genes integrated at aur1 locus. The arrows indicate the positions of the PCR primers for the ChIP assays conducted shown in panels B and D. (B) The in vivo HMO1 binding to the reporter genes was analyzed by ChIP assays. The strains expressing the TAP-tagged HMO1 and containing the RPS5 promoter (YTK8573)- or the RPL10 promoter (YTK8574)-driven mini-CLN2 reporter gene were grown in YPD (yeast extract, peptone, dextrose) medium to mid-log phase at 30°C. ChIP assays were conducted as described in the legends of Fig. 1A and 3B. (C) The quantification of the raw data shown in panel B was performed as described in the legend of Fig. 3C. (D) The in vivo FHL1 binding to the reporter genes was analyzed by ChIP assays. The HMO1 strains expressing the TAP-tagged FHL1 and containing the RPS5 promoter (YTK8869)- or the RPL10 promoter (YTK8871)-driven mini-CLN2 reporter gene or the Δ_hmo1_ strains expressing the TAP-tagged FHL1 and containing the RPS5 promoter (YTK8868)- or RPL10 promoter (YTK8870)-driven mini-CLN2 reporter gene were grown in SC medium to mid-log phase at 25°C. ChIP assays were conducted as described in the legends of Fig. 1A and 3B. (E) The quantification of the raw data shown in panel D was performed as described in the legend of Fig. 3C. (F) The expression of the chromosomal CLN2 (indicated with a filled triangle to the right), RPS5, RPL10, and TEF2 genes and the mini-CLN2 reporter gene (indicated with an open triangle to the right) were measured by Northern blot analysis. The same set of yeast strains that were described in panel D were grown in SC medium to mid-log phase at 25°C. Total RNA was prepared and separated on the gel and hybridized with the gene-specific probes as described in the legend of Fig. 2A. (G) The quantification of the raw data shown in panel F was performed as described in the legend of Fig. 6B. IP, immunoprecipitate; WT, wild type.
FIG. 8.
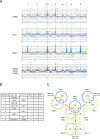
The identification of the in vivo target genes of HMO1, FHL1 and RAP1. (A) The genome-wide ChIP analyses were conducted to identify in vivo target genes of HMO1, FHL1 and RAP1. The strains expressing the PK-tagged HMO1 (YTK8534) or the TAP-tagged RAP1 (YTK8663) were grown in YPD (yeast extract, peptone, dextrose) medium to mid-log phase at 30°C, whereas the strain expressing the TAP-tagged FHL1 (YTK8872) was grown in SC medium to mid-log phase at 30°C. The cross-linked chromatin was prepared and precipitated with IgG-Sepharose (RAP1 and FHL1) or anti-PK tag immunoglobulin G and Dynabeads protein G (HMO1), and then analyzed by GeneChip (Saccharomyces cerevisiae Tiling 1.0F Array; Affymetrix). The orange, green, and blue vertical bars represent the significant binding of HMO1, FHL1, and RAP1 to the region between 600,000 and 700,000 of chromosome X (the coordinates in kilobases are shown at the bottom of each panel). The horizontal small squares with a different color in each panel indicate the ORFs. The bottom panel represents the merged image of the top three panels. The broken vertical lines going through the three panels and with the numbers at the top (1 to 9) indicate the positions of the genes targeted by at least one of the three (HMO1, FHL1, or RAP1) factors. Note that the vertical bars shown in light colors in the top three panels represent signals that were less significant (i.e., clusters that satisfy the requirement for P values are not contiguous) and thereby were not counted in this study. In the merged image, the thick-colored vertical bars are also shown light colors to increase their transparency. (B) The summary of the target genes identified in panel A. The numbers in the left-most column correspond to those of binding sites that are depicted by the broken vertical lines in panel A. The genes on the Watson (W) and Crick (C) strands, whose promoters are bound by HMO1, FHL1, or RAP1, are summarized in this table. (C) A Venn diagram of the genes targeted by HMO1, FHL1, and RAP1. The number of target loci corresponding to each segment identified by the genome-wide ChIP analyses is indicated.
FIG. 9.
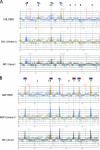
The effect of Δ_hmo1_ on FHL1 and RAP1 binding to the chromosome. (A) The genome-wide ChIP analyses were conducted as described in the legend of Fig. 8A to examine the effect of Δ_hmo1_ on FHL1 binding to the chromosome. The HMO1 (YTK8872) or Δ_hmo1_ (YTK8873) strains expressing the TAP-tagged FHL1 were grown in SC medium to mid-log phase at 30°C. The orange and blue vertical bars represent the significant binding of FHL1 in YTK8872 (top panel) and YTK8873 (middle panel) to the same chromosomal region as described in the legend of Fig. 8A. The bottom panel represents the merged image of the upper two panels. The broken vertical lines represent that as described in the legend of Fig. 8A. The small red or blue triangle flags at the top of these lines indicate that the FHL1 binding to each target site was increased or decreased by Δ_hmo1_, respectively. (B) The genome-wide ChIP analyses were conducted as described in the legend of Fig. 8A to examine the effect of Δ_hmo1_ on RAP1 binding to the chromosome. The HMO1 (YTK8863) or Δ_hmo1_ (YTK8865) strains expressing the TAP-tagged RAP1 were grown in YPD (yeast extract, peptone, dextrose) medium to mid-log phase at 30°C. The orange and blue vertical bars represent the significant binding of RAP1 in YTK8863 (top panel) and YTK8865 (middle panel), and the bottom panel represents the merged image of the upper two panels, as described for panel A. The broken vertical lines and the attached small flags are as described for panel A. The rectangle composed of two triangles (blue and red) represents the target site where the peak width was narrowed and the peak height was increased by Δ_hmo1_. Notably, such an effect of Δ_hmo1_ on the peak shape was observed much more frequently in panel B than in panel A. WT, wild type.
FIG. 10.
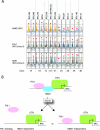
The classification of the RPGs based on the HMO1 abundance and the HMO1 dependence of FHL1 and RAP1 binding. (A) The examples of the RPGs that are grouped into classes 1A to E, 2A and B, and 3A and B (see details in the text and Table 1). These were extracted from the data of the genome-wide ChIP analyses (see Fig. S2, S7, and S8 in the supplemental material). The binding of HMO1 in the HMO1 strain and the binding of FHL1 and RAP1 in the _HMO1/Δ_hmo1 strains (middle and bottom panels; these are merged images as shown in Fig. 9A and B, respectively) are shown for each RPG as indicated at the top. Red triangles and asterisks indicate the positions of the peaks and ORFs, respectively. Note that the results obtained in the top and middle panels are consistent with those of ChIP analyses conducted individually and shown in Fig. 4 and 5. (B) A schematic model depicting the two distinct binding modes for FHL1 to the RPG promoters. FHL1 binds to some RPG promoters in an HMO1-dependent manner (e.g., RPS5), whereas FHL1 binds to other RPG promoters in an HMO1-independent manner (e.g., RPL10). WT, wild type.
Similar articles
- Yeast HMO1: Linker Histone Reinvented.
Panday A, Grove A. Panday A, et al. Microbiol Mol Biol Rev. 2016 Nov 30;81(1):e00037-16. doi: 10.1128/MMBR.00037-16. Print 2017 Mar. Microbiol Mol Biol Rev. 2016. PMID: 27903656 Free PMC article. Review. - An HMG protein, Hmo1, associates with promoters of many ribosomal protein genes and throughout the rRNA gene locus in Saccharomyces cerevisiae.
Hall DB, Wade JT, Struhl K. Hall DB, et al. Mol Cell Biol. 2006 May;26(9):3672-9. doi: 10.1128/MCB.26.9.3672-3679.2006. Mol Cell Biol. 2006. PMID: 16612005 Free PMC article. - Hmo1 is required for TOR-dependent regulation of ribosomal protein gene transcription.
Berger AB, Decourty L, Badis G, Nehrbass U, Jacquier A, Gadal O. Berger AB, et al. Mol Cell Biol. 2007 Nov;27(22):8015-26. doi: 10.1128/MCB.01102-07. Epub 2007 Sep 17. Mol Cell Biol. 2007. PMID: 17875934 Free PMC article. - Both HMG boxes in Hmo1 are essential for DNA binding in vitro and in vivo.
Higashino A, Shiwa Y, Yoshikawa H, Kokubo T, Kasahara K. Higashino A, et al. Biosci Biotechnol Biochem. 2015;79(3):384-93. doi: 10.1080/09168451.2014.978258. Epub 2014 Nov 20. Biosci Biotechnol Biochem. 2015. PMID: 25410521 - Physiological function of FKBP12, a primary target of rapamycin/FK506: a newly identified role in transcription of ribosomal protein genes in yeast.
Kasahara K. Kasahara K. Curr Genet. 2021 Jun;67(3):383-388. doi: 10.1007/s00294-020-01142-3. Epub 2021 Jan 12. Curr Genet. 2021. PMID: 33438053 Review.
Cited by
- Regulation of ribosomal protein genes: An ordered anarchy.
Petibon C, Malik Ghulam M, Catala M, Abou Elela S. Petibon C, et al. Wiley Interdiscip Rev RNA. 2021 May;12(3):e1632. doi: 10.1002/wrna.1632. Epub 2020 Oct 10. Wiley Interdiscip Rev RNA. 2021. PMID: 33038057 Free PMC article. Review. - African trypanosomes expressing multiple VSGs are rapidly eliminated by the host immune system.
Aresta-Branco F, Sanches-Vaz M, Bento F, Rodrigues JA, Figueiredo LM. Aresta-Branco F, et al. Proc Natl Acad Sci U S A. 2019 Oct 8;116(41):20725-20735. doi: 10.1073/pnas.1905120116. Epub 2019 Sep 25. Proc Natl Acad Sci U S A. 2019. PMID: 31554700 Free PMC article. - Two RNA polymerase I subunits control the binding and release of Rrn3 during transcription.
Beckouet F, Labarre-Mariotte S, Albert B, Imazawa Y, Werner M, Gadal O, Nogi Y, Thuriaux P. Beckouet F, et al. Mol Cell Biol. 2008 Mar;28(5):1596-605. doi: 10.1128/MCB.01464-07. Epub 2007 Dec 17. Mol Cell Biol. 2008. PMID: 18086878 Free PMC article. - Target of rapamycin signaling regulates high mobility group protein association to chromatin, which functions to suppress necrotic cell death.
Chen H, Workman JJ, Tenga A, Laribee RN. Chen H, et al. Epigenetics Chromatin. 2013 Sep 2;6(1):29. doi: 10.1186/1756-8935-6-29. Epigenetics Chromatin. 2013. PMID: 24044743 Free PMC article. - Yeast HMO1: Linker Histone Reinvented.
Panday A, Grove A. Panday A, et al. Microbiol Mol Biol Rev. 2016 Nov 30;81(1):e00037-16. doi: 10.1128/MMBR.00037-16. Print 2017 Mar. Microbiol Mol Biol Rev. 2016. PMID: 27903656 Free PMC article. Review.
References
- Agresti, A., and M. E. Bianchi. 2003. HMGB proteins and gene expression. Curr. Opin. Genet. Dev. 13:170-178. - PubMed
- Amberg, D. C., D. J. Burke, and J. N. Strathern. 2005. Methods in yeast genetics: a Cold Spring Harbor Laboratory course manual. Cold Spring Harbor Laboratory Press, Cold Spring Harbor, NY.
- Bauerle, K. T., E. Kamau, and A. Grove. 2006. Interactions between N- and C-terminal domains of the Saccharomyces cerevisiae high-mobility group protein HMO1 are required for DNA bending. Biochemistry 45:3635-3645. - PubMed
Publication types
MeSH terms
Substances
LinkOut - more resources
Full Text Sources
Molecular Biology Databases
Research Materials
