Salmonella enterica serovar typhimurium exploits inflammation to compete with the intestinal microbiota - PubMed (original) (raw)
. 2007 Oct;5(10):2177-89.
doi: 10.1371/journal.pbio.0050244.
Riccardo Robbiani, Alan W Walker, Astrid M Westendorf, Manja Barthel, Marcus Kremer, Samuel Chaffron, Andrew J Macpherson, Jan Buer, Julian Parkhill, Gordon Dougan, Christian von Mering, Wolf-Dietrich Hardt
Affiliations
- PMID: 17760501
- PMCID: PMC1951780
- DOI: 10.1371/journal.pbio.0050244
Salmonella enterica serovar typhimurium exploits inflammation to compete with the intestinal microbiota
Bärbel Stecher et al. PLoS Biol. 2007 Oct.
Abstract
Most mucosal surfaces of the mammalian body are colonized by microbial communities ("microbiota"). A high density of commensal microbiota inhabits the intestine and shields from infection ("colonization resistance"). The virulence strategies allowing enteropathogenic bacteria to successfully compete with the microbiota and overcome colonization resistance are poorly understood. Here, we investigated manipulation of the intestinal microbiota by the enteropathogenic bacterium Salmonella enterica subspecies 1 serovar Typhimurium (S. Tm) in a mouse colitis model: we found that inflammatory host responses induced by S. Tm changed microbiota composition and suppressed its growth. In contrast to wild-type S. Tm, an avirulent invGsseD mutant failing to trigger colitis was outcompeted by the microbiota. This competitive defect was reverted if inflammation was provided concomitantly by mixed infection with wild-type S. Tm or in mice (IL10(-/-), VILLIN-HA(CL4-CD8)) with inflammatory bowel disease. Thus, inflammation is necessary and sufficient for overcoming colonization resistance. This reveals a new concept in infectious disease: in contrast to current thinking, inflammation is not always detrimental for the pathogen. Triggering the host's immune defence can shift the balance between the protective microbiota and the pathogen in favour of the pathogen.
Conflict of interest statement
Competing interests. The authors have declared that no competing interests exist.
Figures
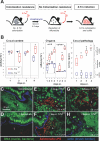
Figure 1. Microbiota Outcompete S. Tmavir but not S. Tmwt
(A) Streptomycin-treated mouse model. The antibiotic transiently reduces the microbiota (grey circles) in the lumen of the large intestine, reduces colonization resistance, and allows colonization and induction of colitis by S. Tmwt. (B) Streptomycin-treated C57BL/6 mice (n = 7 per group) were infected with S. Tmavir (blue) or S. Tmwt (red; 5 × 10⁷ CFU i.g.). At indicated time points mice were sacrificed, S. Tm loads were determined in cecal content, mLN, and spleen, and cecal pathology was scored. Detection limits (dotted lines): cecal content, 10 CFU/g; mLN, 10 CFU/organ; spleen, 20 CFU/organ. *, p ≤ 0.05; statistically significant difference between S. Tmavir and S. Tmwt. Boxes indicate 25th and 75th percentiles, black bars indicate medians, and whiskers indicate data ranges. (C–H) Representative confocal fluorescence microscopy images of cecum tissue sections from the mice shown in (B). Nuclei and bacterial DNA are stained by Sytox green (green), the epithelial brush border actin by Alexa-647-phalloidin (blue), and extracellular S. Tm in the intestinal lumen by anti–S. Tm LPS antiserum (red). Normal microbiota in unmanipulated mice (C), microbiota 1 d after streptomycin (sm) treatment (D), streptomycin-treated mice infected for 1 or 4 d with S. Tmavir or S. Tmwt (E–H). The S. Tm colonization levels are indicated (CFU/g); L, cecum lumen.
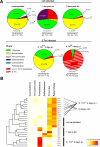
Figure 2. 16S rRNA Gene Sequence Analysis of Microbiota Manipulation by S. Tmwt and S. Tmavir in the Streptomycin Mouse Model
Cecal contents were recovered from unmanipulated mice, mice at days 1 or 5 after streptomycin treatment (20 mg i.g.), and streptomycin-treated mice 4 d after infection with S. Tmavir and S. Tmwt (5 × 10⁷ CFU i.g.; all n = 5). Total DNA was extracted, and bacterial 16S rRNA genes were PCR-amplified using universal bacterial primers, cloned, and sequenced (approximately 100 sequences per animal; five animals per group; see Materials and Methods). (A) Pie diagrams showing the microbiota composition at the phylum level. Numbers below the diagrams indicate bacteria/gram cecal content as defined by Sytox green staining. *The lower bacterial density in S. Tmwt–infected mice is attributable to a high proportion of cellular debris in the intestinal lumen (see Figure 1G). #In these groups no Salmonella 16S rRNA genes were identified. ‡Proteobacterial sequences belonged to Salmonella (E. coli) in the following percentages: 91 (1), 15 (70), 87 (11), 55 (38), and 100 (0). See also Table S1. (B) Visual depiction of the microbiota composition of individual mice. The animals were grouped based on the similarity of their microbiota composition at the phylum level (using the Canberra distance as metric). The resulting groupings are depicted as a dendrogram, and observed phylum counts for each mouse are shown as a heat map (0%–100% of all identified 16S rRNA gene sequences). Labels indicate unique mouse identifier numbers. The experimental groups are indicated. p.sm., post–streptomycin treatment.
Figure 3. S. Tmwt Can Suppress Colonization with L. reuteri RRRif
Groups of streptomycin-treated mice (n = 5) were first infected with S. Tmavir or S. Tmwt (5 × 10⁷ CFU i.g.) and inoculated 1 d later with L. reuteri RRRif (8 × 10⁶ CFU i.g.). Colonization levels were monitored in the feces (2 and 3 d p.i.), the cecal content (4 d p.i.), the mLN, and the spleen. Box plots show S. Tmavir (open blue boxes), S. Tmwt (open red boxes), L. reuteri RRRif in S. Tmavir–infected mice (filled blue boxes), and L. reuteri RRRif in S. Tmwt–infected mice (filled red boxes). In all groups cecal pathology was scored at day 4 p.i. *, p ≤ 0.05; statistically significant difference in L. reuteri RRRif colonization between S. Tmavir– and S. Tmwt–infected mice. L. reuteri RRRif was not detected in mLN and spleen. Boxes indicate 25th and 75th percentiles, black bars indicate medians, and whiskers indicate data ranges.
Figure 4. S. Tmwt–Induced Inflammation Enhances Colonization of S. Tmavir
(A) Mixed infection with S. Tmwt complements the colonization defect of S. Tmavir. Streptomycin-treated C57BL/6 mice (n = 5/group) were infected with 5 × 10⁷ CFU i.g. of S. Tmavir only (open blue boxes), S. Tmwt only (open red boxes), or a 1:1 mixture of the two strains (filled blue and red boxes, respectively). Colonization was measured in the feces (days 0–3 p.i.) and the cecal content (day 4 p.i.) (left panel). Colonization of mLN and spleen (middle panel) and cecal pathology (right panel) were determined at day 4 p.i. (B) Mixed infection with S. Tmwt complements the colonization defect of S. Tmavir in a chronic Salmonella colitis model (129Sv/Ev mice). Groups of streptomycin-treated mice (NRAMP+ 129Sv/Ev mice raised by C57BL/6 foster mice; n = 4 per group) were infected with 5 × 10⁷ CFU i.g. of S. Tmavir only (blue-striped boxes) or a 1:1 mixture of S. Tmavir and S. Tmwt (filled blue and red boxes, respectively). One additional control group (four streptomycin-treated C57BL/6 mice) was infected with S. Tmavir (5 × 10⁷ CFU i.g.; open blue boxes). Colonization was measured in the feces (days 1–40 p.i.) and the cecal content (day 47 p.i.) (left panel). Colonization of mLN and spleen (middle panel) and cecal pathology (right panel) were analyzed at day 47 p.i. Boxes indicate 25th and 75th percentiles, black bars indicate medians, and whiskers indicate data ranges.
Figure 5. Intestinal Inflammation in IL10−/− Mice Enhances Colonization of S. Tmavir
(A) C3H/HeJBirIL10−/− (n = 18) and C3H/HeJ control animals (n = 5) were infected with S. Tmavir (5 × 10⁷ CFU i.g.; no streptomycin treatment). S. Tmavir colonization was analyzed in feces (day 1 p.i.) and cecum content (day 2 p.i.), and cecal pathology was scored (see Material and Methods). Open blue circles indicate mice with colitis score < 4; blue circles with red filling indicate mice with colitis score ≥ 4. *, p = 0.03; **, p = 0.004. (B) C57BL/6IL10−/− (n = 12) and C57BL/6 control animals (n = 4) were infected with S. Tmavir (5 × 10⁷ CFU i.g.; no streptomycin treatment). S. Tmavir colonization and cecal pathology were analyzed as described above. Open blue circles indicate mice with colitis score < 4; blue circles with red filling indicate mice with colitis score ≥ 4. *, p = 0.006; **, p = 0.016. †One animal was sacrificed at the end of day 1 p.i. for humane reasons.
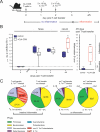
Figure 6. Gut Inflammation in the VILLIN-HACL4-CD8 Model Boosts S. Tmavir Colonization
(A) The VILLIN-HACL4-CD8 model including the time course of intestinal inflammation and the infection regime employed in the experiment shown below. (B) Gut colonization by S. Tmavir is enhanced when inflammation occurs. Seven VILLIN-HA mice received 4 × 10⁶ CL4-CD8 T cells (open white boxes) at day 0. Five unmanipulated VILLIN-HA transgenic mice served as control (blue boxes; no T cell transfer). Both groups of mice were inoculated with 5 × 10⁷ CFU i.g. of S. Tmavir at days 1 and 2. S. Tmavir colonization was measured in the feces (days 1 and 2 p.i.). When symptoms of colitis (weight loss and diarrhoea) were observable in the animals from the experimental group (day 4/5), mice were sacrificed and S. Tmavir loads in the cecal content (left) as well as cecal pathology (right) were determined (open red boxes indicate inflammation). *, p = 0.01; **, p = 0.003. Boxes indicate 25th and 75th percentiles, black bars indicate medians, and whiskers indicate data ranges. (C) Pie diagrams showing the fecal microbiota composition at the phylum level. The average for n = 2 animals per group (approximately 100 16S rRNA gene sequences per animal) is shown for all groups except “no T cell transfer, not infected”, for which the average for four mice is shown. Information at higher taxonomic resolution is provided in Table S1. The _p_-values are shown in Table S2.
Figure 7. Working Model for the Microbiota–Host–Pathogen Interaction in Health and Disease
Colonization resistance (or lack thereof) results from growth competition between microbiota and incoming pathogens. Host responses can skew growth conditions in the intestinal lumen in either direction. Left: the normal microbiota is shaped by mutually beneficial interactions with the intestinal mucosa and mediates colonization resistance against incoming pathogens. Right: S. Tm employs specific virulence factors for triggering colitis. Inflammation alters the luminal conditions and shifts the growth competition in favour of the pathogen, thus alleviating colonization resistance. Inhibitory effects on the microbiota (a) and/or improved growth conditions for the pathogen (b) may be involved. Furthermore, the microbiota–pathogen growth competition can be affected by antibiotic treatment or by pre-existing intestinal inflammation.
References
- Ley RE, Peterson DA, Gordon JI. Ecological and evolutionary forces shaping microbial diversity in the human intestine. Cell. 2006;124:837–848. - PubMed
- Sonnenburg JL, Xu J, Leip DD, Chen CH, Westover BP, et al. Glycan foraging in vivo by an intestine-adapted bacterial symbiont. Science. 2005;307:1955–1959. - PubMed
- Hooper LV, Gordon JI. Commensal host-bacterial relationships in the gut. Science. 2001;292:1115–1118. - PubMed
Publication types
MeSH terms
Substances
LinkOut - more resources
Full Text Sources
Other Literature Sources
Medical
Molecular Biology Databases
Research Materials


