Modulation of intestinal goblet cell function during infection by an attaching and effacing bacterial pathogen - PubMed (original) (raw)
Modulation of intestinal goblet cell function during infection by an attaching and effacing bacterial pathogen
Kirk S B Bergstrom et al. Infect Immun. 2008 Feb.
Abstract
The attaching and effacing (A/E) bacterial pathogens enteropathogenic Escherichia coli and enterohemorrhagic E. coli and the related mouse pathogen Citrobacter rodentium colonize their hosts' intestines by infecting the apical surfaces of enterocytes, subverting their function, and they ultimately cause diarrhea. Surprisingly, little is known about the interactions of these organisms with goblet cells, which are specialized epithelial cells that secrete the protective molecules Muc2 and trefoil factor 3 (Tff3) into the intestinal lumen. C. rodentium infection leads to dramatic goblet cell depletion within the infected colon, yet it is not clear whether C. rodentium infects goblet cells or if this pathology is pathogen or host mediated. As determined by immunostaining and PCR, both the number of goblet cells and the expression of genes encoding Muc2 and Tff3 were significantly reduced by day 10 postinfection. While electron microscopy and immunostaining revealed that C. rodentium directly infected a fraction of colonic goblet cells, C. rodentium localization did not correlate with goblet cell depletion. To assess the role of the host immune system in these changes, Rag1 knockout (KO) (T- and B-cell-deficient) mice were infected with C. rodentium. Rag1 KO mice did not exhibit the reduction in the number of goblet cells or in mediator (Muc2 and Tff3) expression observed in infected immunocompetent mice. However, reconstitution of Rag1 KO mice with T and B lymphocytes from C57BL/6 mice restored the goblet cell depletion phenotype during C. rodentium infection. In conclusion, these studies demonstrated that while colonic goblet cells can be subject to direct infection and potential subversion by A/E pathogens in vivo, it is the host immune system that primarily modulates the function of these cells during infection.
Figures
FIG. 1.
C. rodentium infection peaks at day 10 p.i. in C57BL/6 mice. Each symbol indicates the mean for three independent infections, each with three mice per time point. The error bars indicate standard deviations.
FIG. 2.
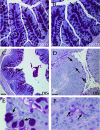
Depletion of mucus-containing goblet cells occurs in the distal colon and is pronounced when the C. rodentium burdens peak. (A to D) PAS staining of formalin-fixed paraffin-embedded tissue sections obtained from the proximal (A and B) and distal (C and D) colons of both naïve (uninfected) mice (A and C) and mice at day 10 p.i (B and D). There was a reduction in overall PAS staining within many crypts in distal colons at day 10 p.i., although scattered PAS-positive cells were still evident (arrows in panel D). Bars = 100 μm. DIS, distal colon; PROX, proximal colon. (E and F) Representative images of PAS-positive cells at day 10 p.i. exhibiting a large mucin-filled goblet cell morphology (arrows in panel E) or a mucin-depleted columnar morphology (arrows in panel F). The images are representative of at least three independent infections with two or three mice per time point.
FIG. 3.
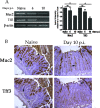
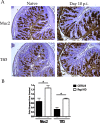
C. rodentium infection results in reduction of Muc2 and Tff3 gene expression. (A) Representative RT-PCR analysis of Muc2 and Tff3 gene expression in distal colonic tissues of naïve C57BL/6 mice or mice at days 6 and 10 p.i. β-Actin was used as a loading control. Differences in levels of expression relative to the levels in naïve (uninfected) mice after normalization to β-actin were determined by densitometric analysis, as shown in the graph on the right. The bars indicate the means for three independently infected mice per time point. The error bars indicate the standard errors of the means. Asterisk, P < 0.05; ns, not significant (_P_ > 0.05), as determined by Student's t test. (B) Immunoperoxidase staining for Muc2 (upper panels) and Tff3 (lower panels) protein (brown) in serial sections of distal colons from either naïve mice (left panels) or mice at day 10 p.i. (right panels). In control mice, Muc2-positive cells are present from the crypt base to the luminal surface, whereas Tff3 expression is restricted to the top half of the crypts (arrows). The arrowheads indicate cells that are coexpressing the Muc2 and Tff3 proteins. Note the lack of staining in intact crypts at day 10 p.i. (arrows in left panels). Bar = 50 μm.
FIG. 4.
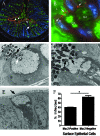
C. rodentium directly infects colonic goblet cells in vivo. (A) Immunofluorescence staining for the C. rodentium translocated effector Tir (red), goblet cell-specific Muc2 (green), and DNA (blue) in distal colonic tissues at day 6 p.i. Tir staining is present in Muc2-positive cells (arrowheads) and Muc2-negative cells within the surface epithelium, progressing down the length of some crypts (arrow). (B) Magnified image of Tir (red) staining (arrows) on the apical surface of cells staining strongly for Muc2 (green) in the apical compartment and exhibiting distinct goblet cell morphology. GA, goblet cell apical compartment; GN, goblet cell nucleus; E, enterocyte; L, lumen. Original magnification, ×1,000. (C to E) TEM micrographs of distal colons of C57BL/6 mice taken at day 7 (C) and day 11 (D) following infection with wild-type C. rodentium and at day 7 following infection with Δ_escN C. rodentium_ (E). C. rodentium is in direct contact with goblet cells in panels C and D (black arrows). In panel C, effacement of microvilli (black arrows) on a goblet cell and internalization of bacteria into the apical granule mass of the goblet cell (white arrow) can be seen. In panel E, no infection of goblet cells and intact microvilli (arrow) can be seen following infection with Δ_escN C. rodentium_. (F) Graph showing the proportions of Muc2-positive (goblet) cells and Muc2-negative (nongoblet) cells of the surface epithelia that were positive for Tir staining at day 6 p.i. The bars indicate the averages for three mice from two independent infections. The error bars indicate the standard errors of the means. Asterisk, P < 0.05, as determined by Student's t test.
FIG. 5.
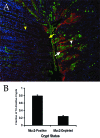
C. rodentium associates with crypts that are strongly positive for Muc2 at day 10 p.i. (A) Dual immunofluorescence staining for C. rodentium Tir (red) and Muc2 (green) in a distal colon at day 10 p.i. Tir staining (white arrow) is associated with crypts strongly positive for Muc2 (white arrowhead), but little if any Tir staining (yellow arrow) is associated with crypts that are weakly positive for Muc2 (yellow arrowhead). Note the frequent colocalization of Tir with Muc2-postive cells and luminal Muc2. (B) Proportions of crypts exhibiting depletion of Muc2-positive goblet cells that are positive for Tir compared to crypts that are not depleted of Muc2-postive goblet cells. The bars indicate the averages for 30 crypts counted within colonic sections from two individual mice, and the error bars indicate standard deviations.
FIG. 6.
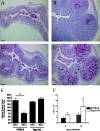
C. rodentium infection does not result in goblet cell depletion phenotype in Rag1 KO mice. (A to D) Histology of PAS- and hematoxylin-stained distal colonic sections taken from (A) naïve C57BL/6 mice, (B) C57BL/6 mice at day 10 p.i., (C) naïve Rag1 KO mice, and (D) Rag1 KO mice at day 10 p.i. The mature PAS-positive cell population is still large in Rag1 KO mice at day 10 p.i. Heavily infected mucin-depleted atrophic crypts are indicated by arrowheads. Original magnification, ×100. Bar = 100 μm. (E) Quantitation of goblet cells in distal colons from naïve C57BL/6 and Rag1 KO mice or from infected mice at day 10 p.i. The bars indicate the mean numbers of goblet cells per 100 epithelial cells counted in PAS- and hematoxylin-stained sections of the distal colon. The error bars indicate standard errors of the means for at least three independent infections with one to three mice per time point. Asterisk, P < 0.05. (F) Comparison of numbers of bacteria in whole colons of C57BL/6 mice (filled bars) and Rag1 KO mice (open bars) at day 10 p.i. The bars indicate the means from three independent infections, each with two or three mice per time point. The error bars indicate the standard deviations. Asterisk, P < 0.05, as determined by the Mann-Whitney t test.
FIG. 7.
Muc2 and Tff3 are abundantly expressed in Rag1 KO mice following C. rodentium infection. (A) Immunohistochemical staining for Muc2 (upper panels) and Tff3 (lower panels) in the distal colons of naïve mice (right panels) and infected mice (left panels). Note the abundance of Tff3 and Muc2 in crypts that are evidently undergoing hyperplasia, with staining patterns similar to those of naïve mice (arrows). Bars = 50 μm. Original magnification, ×200. (B) Quantitative RT-PCR analysis of Muc2 and Tff3 gene expression in distal colons from naïve and infected C57BL/6 and Rag1 KO mice. Each bar indicates the mean relative expression for four mice from three independent infections compared to naïve mice of the same strain, which were assigned an arbitrary expression value of 1.00. Genes encoding Muc2 and Tff3 were both expressed at significantly higher levels in Rag1 KO mice than in C57BL/6 mice at day 10 p.i. All samples were normalized to β-actin. The error bars indicate the standard errors of the means. Asterisk, P < 0.05, as determined by the Mann-Whitney t test.
FIG. 8.
Cytokine gene expression during C. rodentium infection: quantitative RT-PCR analysis of TNF-α and IL-17 expression in distal colons taken from C57BL/6 and Rag1 KO at day 10 following C. rodentium infection. Induction of TNF-α was moderately increased in both strains at day 10 p.i.; the levels in C57BL/6 mice were increased, but the difference was not significant (P = 0727). However, IL-17 gene expression was significantly increased in infected C57BL/6 mice compared to the minimal IL-17 expression observed in infected Rag1 KO mice. All samples were normalized to β-actin. The bars indicate the means for eight C57BL/6 mice and four Rag1 KO mice from three independent infections. The error bars indicate the standard errors of the means. Asterisk, P < 0.05, as determined by the Mann-Whitney t test.
FIG. 9.
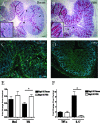
Adaptive transfer of T and B cells into Rag1 KO mice restored the goblet cell depletion phenotype during C. rodentium infection. (A and B) PAS staining of distal colons removed on day 10 p.i. from Rag1 KO mice that were reconstituted with T and B lymphocytes from naïve C57BL/6 mice (Recon) (A) or with PBS (nonreconstituted control) (B). The arrows indicate intact crypts exhibiting reduced PAS staining and numerous hypotrophic goblet cells. The asterisks indicate crypts magnified in the insets. Note that reduced PAS staining in PBS-treated mice (B) was associated mainly with crypts that were severely disrupted due to bacterial overload (arrowheads), which was not observed in infected reconstituted mice. Original magnification, ×100. Bar = 100 μm. (C and D) Anti-CD3 staining showing greater numbers of infiltrating CD3-positive cells in the lamina propria and submucosa of reconstituted Rag1 KO mice (arrows) (C) than in the lamina propria and submucosa of PBS-treated mice (D). Original magnification, ×200. Bar = 50 μm. (E and F) Quantitative RT-PCR analysis of expression of genes encoding Muc2 and Tff3 (E) or TNF-α and IL-17 (F) in distal colons of reconstituted or nonreconstituted (PBS-treated) mice at day 10 p.i. All samples were normalized to β-actin. The bars indicate the means for seven reconstituted mice and three nonreconstituted mice from two independent infections. The error bars indicate the standard errors of the means. Asterisk, P < 0.05, as determined by the Mann-Whitney t test.
Similar articles
- Goblet Cell Derived RELM-β Recruits CD4+ T Cells during Infectious Colitis to Promote Protective Intestinal Epithelial Cell Proliferation.
Bergstrom KS, Morampudi V, Chan JM, Bhinder G, Lau J, Yang H, Ma C, Huang T, Ryz N, Sham HP, Zarepour M, Zaph C, Artis D, Nair M, Vallance BA. Bergstrom KS, et al. PLoS Pathog. 2015 Aug 18;11(8):e1005108. doi: 10.1371/journal.ppat.1005108. eCollection 2015 Aug. PLoS Pathog. 2015. PMID: 26285214 Free PMC article. - Central role for B lymphocytes and CD4+ T cells in immunity to infection by the attaching and effacing pathogen Citrobacter rodentium.
Simmons CP, Clare S, Ghaem-Maghami M, Uren TK, Rankin J, Huett A, Goldin R, Lewis DJ, MacDonald TT, Strugnell RA, Frankel G, Dougan G. Simmons CP, et al. Infect Immun. 2003 Sep;71(9):5077-86. doi: 10.1128/IAI.71.9.5077-5086.2003. Infect Immun. 2003. PMID: 12933850 Free PMC article. - CD4+ T cells drive goblet cell depletion during Citrobacter rodentium infection.
Chan JM, Bhinder G, Sham HP, Ryz N, Huang T, Bergstrom KS, Vallance BA. Chan JM, et al. Infect Immun. 2013 Dec;81(12):4649-58. doi: 10.1128/IAI.00655-13. Epub 2013 Oct 7. Infect Immun. 2013. PMID: 24101690 Free PMC article. - Citrobacter rodentium of mice and man.
Mundy R, MacDonald TT, Dougan G, Frankel G, Wiles S. Mundy R, et al. Cell Microbiol. 2005 Dec;7(12):1697-706. doi: 10.1111/j.1462-5822.2005.00625.x. Cell Microbiol. 2005. PMID: 16309456 Review. - Overview of the Effect of Citrobacter rodentium Infection on Host Metabolism and the Microbiota.
Hopkins EGD, Frankel G. Hopkins EGD, et al. Methods Mol Biol. 2021;2291:399-418. doi: 10.1007/978-1-0716-1339-9_20. Methods Mol Biol. 2021. PMID: 33704766 Review.
Cited by
- Dclk1 in tuft cells promotes inflammation-driven epithelial restitution and mitigates chronic colitis.
Yi J, Bergstrom K, Fu J, Shan X, McDaniel JM, McGee S, Qu D, Houchen CW, Liu X, Xia L. Yi J, et al. Cell Death Differ. 2019 Sep;26(9):1656-1669. doi: 10.1038/s41418-018-0237-x. Epub 2018 Nov 26. Cell Death Differ. 2019. PMID: 30478383 Free PMC article. - Cystic fibrosis growth retardation is not correlated with loss of Cftr in the intestinal epithelium.
Hodges CA, Grady BR, Mishra K, Cotton CU, Drumm ML. Hodges CA, et al. Am J Physiol Gastrointest Liver Physiol. 2011 Sep;301(3):G528-36. doi: 10.1152/ajpgi.00052.2011. Epub 2011 Jun 9. Am J Physiol Gastrointest Liver Physiol. 2011. PMID: 21659619 Free PMC article. - Mucin dynamics in intestinal bacterial infection.
Lindén SK, Florin TH, McGuckin MA. Lindén SK, et al. PLoS One. 2008;3(12):e3952. doi: 10.1371/journal.pone.0003952. Epub 2008 Dec 17. PLoS One. 2008. PMID: 19088856 Free PMC article. - The StcE metalloprotease of enterohaemorrhagic Escherichia coli reduces the inner mucus layer and promotes adherence to human colonic epithelium ex vivo.
Hews CL, Tran SL, Wegmann U, Brett B, Walsham ADS, Kavanaugh D, Ward NJ, Juge N, Schüller S. Hews CL, et al. Cell Microbiol. 2017 Jun;19(6):e12717. doi: 10.1111/cmi.12717. Epub 2017 Feb 15. Cell Microbiol. 2017. PMID: 28054754 Free PMC article. - Effects of Enteromyxum leei (Myxozoa) infection on gilthead sea bream (Sparus aurata) (Teleostei) intestinal mucus: glycoprotein profile and bacterial adhesion.
Estensoro I, Jung-Schroers V, Álvarez-Pellitero P, Steinhagen D, Sitjà-Bobadilla A. Estensoro I, et al. Parasitol Res. 2013 Feb;112(2):567-76. doi: 10.1007/s00436-012-3168-3. Epub 2012 Oct 20. Parasitol Res. 2013. PMID: 23086443
References
- Arnold, J. W., G. R. Klimpel, and D. W. Niesel. 1993. Tumor necrosis factor (TNFα) regulates intestinal mucus production during salmonellosis. Cell. Immunol. 151336-344. - PubMed
- Artis, D., C. S. Potten, K. J. Else, F. D. Finkelman, and R. K. Grencis. 1999. Trichuris muris: host intestinal epithelial cell hyperproliferation during chronic infection is regulated by interferon-gamma. Exp. Parasitol. 92144-153. - PubMed
- Artis, D., M. L. Wang, S. A. Keilbaugh, W. He, M. Brenes, G. P. Swain, P. A. Knight, D. D. Donaldson, M. A. Lazar, H. R. P. Miller, G. A. Schad, P. Scott, and G. D. Wu. 2004. RELMβ/FIZZ2 is a goblet cell-specific immune-effector molecule in the gastrointestinal tract Proc. Natl. Acad. Sci. USA 10113596-13600. - PMC - PubMed
- Boyle, E. C., N. F. Brown, and B. B. Finlay. 2006. Salmonella enterica serovar Typhimurium effectors SopB, SopE, SopE2 and SipA disrupt tight junction structure and function. Cell. Microbiol. 81946-1957. - PubMed
- Brand, S., F. Beigel, T. Olszak, K. Zitzmann, S. T. Eichhorst, J.-M. Otte, J. Diebold, H. Diepolder, B. Adler, C. J. Auernhammer, B. Goke, and J. Dambacher. 2005. IL-28A and IL-29 mediate antiproliferative and antiviral signals in intestinal epithelial cells and murine CMV infection increases colonic IL-28A expression. Am. J. Physiol. Gastrointest. Liver Physiol. 289G960-G968. - PubMed
Publication types
MeSH terms
Substances
LinkOut - more resources
Full Text Sources
Molecular Biology Databases
Research Materials
Miscellaneous

