Intermediate-affinity LFA-1 binds alpha-actinin-1 to control migration at the leading edge of the T cell - PubMed (original) (raw)
Comparative Study
Intermediate-affinity LFA-1 binds alpha-actinin-1 to control migration at the leading edge of the T cell
Paula Stanley et al. EMBO J. 2008.
Abstract
T lymphocytes use LFA-1 to migrate into lymph nodes and inflammatory sites. To investigate the mechanisms regulating this migration, we utilize mAbs selective for conformational epitopes as probes for active LFA-1. Expression of the KIM127 epitope, but not the 24 epitope, defines the extended conformation of LFA-1, which has intermediate affinity for ligand ICAM-1. A key finding is that KIM127-positive LFA-1 forms new adhesions at the T lymphocyte leading edge. This LFA-1 links to the cytoskeleton through alpha-actinin-1 and disruption at the level of integrin or actin results in loss of cell spreading and migratory speed due to a failure of attachment at the leading edge. The KIM127 pattern contrasts with high-affinity LFA-1 that expresses both 24 and KIM127 epitopes, is restricted to the mid-cell focal zone and controls ICAM-1 attachment. Identification of distinctive roles for intermediate- and high-affinity LFA-1 in T lymphocyte migration provides a biological function for two active conformations of this integrin for the first time.
Figures
Figure 1
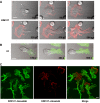
Expression of LFA-1 activation epitopes on migrating T lymphocytes. T cells and freshly isolated primary T lymphocytes migrating on ICAM-1Fc-coated coverslips were fixed and permeabilized before labelling with either KIM127–Alexa546 or 24–Alexa546 addition. Freshly isolated T lymphocytes were exposed for 5 min to SDF-1 (CXCL12) to induce a migratory phenotype. Images are shown in a rainbow false color scale, with the highest expression in red and the lowest blue. The enlarged area of each leading edge is shown with a white box. Scale bar=10 μm.
Figure 2
Effect of mAbs KIM127 and 24 on migrating T cells. (A) Live-cell imaging of T cells migrating on ICAM-1Fc-coated coverslips following addition of directly labelled mAb KIM127 at 0 s. Confocal images showing KIM127–Alexa546 (red) localization are overlaid with the phase images. The leading lamellipodia are indicated by *. Scale bar=10 μm. (B) Images as in panel A but following addition of 24–Alexa488 (green) at 0 s. (C) Addition of KIM127–Alexa488 (green) for 5 min before counterstaining with KIM127–Alexa546 (red) during fixation. Scale bar=5 μm.
Figure 3
Effect of mAb KIM127 on IRM imaging of a T cell migrating on ICAM-1. The image of a single representative T cell migrating on an ICAM-1-coated coverslip is shown with 10 μg/ml KIM127 added at 0 s. KIM127 stabilizes adhesions of leading edge 1 (see arrow) at 30 s shown by the formation of dark contact areas. The cell alters direction, forming leading edge 2, which also becomes stabilized (70 s). This is followed by stabilization of leading edge 3 (130 s) and the process continues until the cell can no longer move. Scale bar=5 μm.
Figure 4
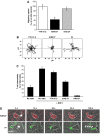
Effect of KIM127 and 24 mAbs on T cell migration and chemotaxis. (A) Speed of migration of T cells on ICAM-1Fc-coated coverslips in the first 10 min following addition of LFA-1 mAbs YTH81.5, KIM127 or 24. Migration speed was calculated for 10 cells per treatment and expressed as a percentage of control cells. Data from a representative experiment are shown (_n_=3; *P<0.01). (B) Migratory tracks of individual T cells in the presence of mAbs YTH81.5, KIM127 or 24 from the same experiment as in panel A. (C) T cell chemotaxis for 60 min across ICAM-1Fc-coated filters in response to 10 nM SDF-1 in the presence or absence of the indicated LFA-1 mAbs. Each condition was run in duplicate. A representative experiment (_n_=3) is shown. (D) Live-cell imaging of T cells migrating on TNF α-activated-HUVECs following addition of fluorescently labelled mAbs (0–180 s). Confocal images of KIM127 (red) or 24 (green) localization are overlaid with phase images. The leading edge is indicated by * and shedding of 24-positive LFA-1 from the trailing edge by white arrows. Scale bar=10 μm.
Figure 5
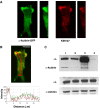
KIM127+LFA-1 binds to cytoskeletal protein α-actinin-1 at the leading edge of T cells. Confocal images of a representative HSB-2 cell transfected with α-actinin-1-GFP migrating on ICAM-1Fc and stained with KIM127–Alexa546 during fixation. (A) _Z_-stack and vertical slice along the _y_-axis of α-actinin–GFP (green) and KIM127+LFA-1-labelled (red) HSB-2 cells are shown. (B) Merged _z_-stack of α-actinin-GFP (green) and KIM127+LFA-1 (red) images. The level of expression of α-actinin-1 (green trace) and KIM127+ LFA-1 (red trace) along the length of the polarized HSB-2 T cell (indicated by red arrow on merged image) is recorded. Scale bar=10 μm. (C) Co-immununoprecipitation of αL and α-actinin-1. T cells were preincubated with primary mAb before lysis and western blotting. Top panel shows lysates of T cells preincubated with the following: lane 1, KIM127; lane 2, 24; lane 3, total LFA-1 mAb 38 and lane 4, control mAb 52 U. Western blotting using αL and α-actinin-1 mAbs shows the extent of co-immunoprecipitation. Middle and bottom panels show total αL and α-actinin-1 levels, respectively, from 10 μl of lysate (_n_=4).
Figure 6
Effect of α-actinin-1 knockdown on T cell migration and adhesion on ICAM-1. (A) Western blot of total HSB-2 cell lysates from the following transfection steps: no siRNA, α-actinin-1 siRNA (ID 9416) or control siRNA transfectants probed for α-actinin-1, talin and α-tubulin. The level of α-actinin-1 knockdown was ∼60% (_n_=3). Two alternative siRNAs to α-actinin-1 (ID 147017 or ID 16804) knocked down by ∼30% (data not shown). (B) Adhesion to ICAM-1 of HSB-2 T cells transfected with no siRNA, control siRNA or α-actinin-1 siRNA (*P<0.01). The cells shown were from the same transfection as in panel A (representative experiment of _n_=3). (C) Average speed of HSB-2 cells transfected with no siRNA, control siRNA or α-actinin-1 siRNA (36 cells each; mean values of _n_=3; *P<0.01). (D) Cell tracks of migrating HSB-2 T cells transfected with control siRNA or siRNA specific for α-actinin-1 from the same data as in panel C and tracked for 10 min (12 cell tracks per condition).
Figure 7
KIM127+ LFA-1 requires attachment to the actin cytoskeleton via α-actinin-1 for spreading and migration on ICAM-1. (A) Confocal image of a representative HSB-2 cell transfected with α-actinin–GFP (green) and counterstained with Alexa546–phalloidin to detect F-actin (red) following fixation. The level of expression of α-actinin–GFP (green trace) and F-actin staining (red trace) along the length of the polarized T cell (indicated by red arrow in merged image) is recorded. Scale bar=10 μm. (B) Average speed of HSB-2 T cells transfected with either GFP, α-actinin–GFP or ΔN-actinin–GFP (α-actinin-1 mutant missing the actin-binding domain) (mean values of _n_=3; 36 cells per condition; *P<0.01). (C) Cell tracks and video microscopy images of HSB-2 transfectants as in panel B; 12 cells tracked per condition. Representative experiment of _n_=3. Scale bar=10 μm.
Figure 8
Effects of β2-actinin-1 peptide on T cell adhesion, migration and morphology on ICAM-1. (A) Western blot of the following is shown: lane 1, total T cell lysate; lane 2, pull down using a biotin-labelled control peptide; lane 3, pull down using biotin-labelled β2-actinin peptide probed for α-actinin-1, talin and vinculin. (B) Average speed of migration of T cells preincubated without peptide, with control peptide or β2-actinin peptide (mean values of _n_=3; 24 cells per condition). (C) Video microscopy images of T cells preincubated for 30 min with 50 μg/ml control or β2-actinin peptide. Scale bar=10 μm.
Figure 9
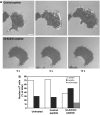
Effect of β2-actinin-1 peptide on the IRM image of migrating T cells. (A) IRM images of representative T cells treated with control scrambled peptide or β2-actinin peptide for 30 min before migrating on ICAM-1. The three frames show images recorded at 0, 6 and 12 s. Images are representative of 40 cells per treatment group (_n_=3). Scale bar=5 μm. (B) Analysis of IRM images of T cells treated with β2-actinin or control peptide. The IRM ‘bright' image for each cell was scored as extensive (lamella+), partial (intermediate) or absence of obvious lamella/lamellipodial region (_n_=40 for each group in two experiments).
Figure 10
Effect of β2-actinin peptide on the IRM image of migrating T cells following treatment with KIM127. IRM images are shown of T cells that are pretreated with 10 μg/ml KIM127, resulting in KIM127-stabilized adhesions (see dark contact areas). The cells are then treated with either β2-actinin or control peptide and the IRM image recorded after 200 s. The β2-actinin peptide caused the KIM127 stabilized adhesions to diminish, whereas the control peptide had no effect. Scale bar=10 μm.
Figure 11
FRET analysis showing association between LFA-1 and α-actinin-1 at the leading edge of HSB-2 T cells. (A) AdFRET profile showing fluorescence intensity of acceptor Alexa546-labelled α-actinin-1 and donor GFP-LFA-1 for five frames before and five frames after photobleaching of the acceptor (_n_=10 for each zone tested). The increase in fluorescence intensity of donor LFA-1 occurs at the leading edge in the lamella of the migrating T cell but not in the focal zone or uropod. (B) AdFRET profiles at the leading edge were determined as in panel A for cells treated with β2-actinin peptide, control peptide or no peptide. No FRET was seen with addition of β2-actinin peptide, showing that LFA-1 does associate with α-actinin-1 through the β2 cytoplasmic tail sequence covered by the β2-actinin peptide.
Similar articles
- CD18 activation epitopes induced by leukocyte activation.
Beals CR, Edwards AC, Gottschalk RJ, Kuijpers TW, Staunton DE. Beals CR, et al. J Immunol. 2001 Dec 1;167(11):6113-22. doi: 10.4049/jimmunol.167.11.6113. J Immunol. 2001. PMID: 11714770 - Cathepsin X cleaves the beta2 cytoplasmic tail of LFA-1 inducing the intermediate affinity form of LFA-1 and alpha-actinin-1 binding.
Jevnikar Z, Obermajer N, Pecar-Fonović U, Karaoglanovic-Carmona A, Kos J. Jevnikar Z, et al. Eur J Immunol. 2009 Nov;39(11):3217-27. doi: 10.1002/eji.200939562. Eur J Immunol. 2009. PMID: 19750481 - LFA-1 fine-tuning by cathepsin X.
Jevnikar Z, Obermajer N, Kos J. Jevnikar Z, et al. IUBMB Life. 2011 Sep;63(9):686-93. doi: 10.1002/iub.505. Epub 2011 Jul 27. IUBMB Life. 2011. PMID: 21796748 Review. - The role of the integrin LFA-1 in T-lymphocyte migration.
Smith A, Stanley P, Jones K, Svensson L, McDowall A, Hogg N. Smith A, et al. Immunol Rev. 2007 Aug;218:135-46. doi: 10.1111/j.1600-065X.2007.00537.x. Immunol Rev. 2007. PMID: 17624950 Review. - Epitope mapping of antibodies to the C-terminal region of the integrin beta 2 subunit reveals regions that become exposed upon receptor activation.
Lu C, Ferzly M, Takagi J, Springer TA. Lu C, et al. J Immunol. 2001 May 1;166(9):5629-37. doi: 10.4049/jimmunol.166.9.5629. J Immunol. 2001. PMID: 11313403
Cited by
- Distinct roles for LFA-1 affinity regulation during T-cell adhesion, diapedesis, and interstitial migration in lymph nodes.
Park EJ, Peixoto A, Imai Y, Goodarzi A, Cheng G, Carman CV, von Andrian UH, Shimaoka M. Park EJ, et al. Blood. 2010 Feb 25;115(8):1572-81. doi: 10.1182/blood-2009-08-237917. Epub 2009 Dec 18. Blood. 2010. PMID: 20023213 Free PMC article. - LFA-1 Controls Th1 and Th17 Motility Behavior in the Inflamed Central Nervous System.
Dusi S, Angiari S, Pietronigro EC, Lopez N, Angelini G, Zenaro E, Della Bianca V, Tosadori G, Paris F, Amoruso A, Carlucci T, Constantin G, Rossi B. Dusi S, et al. Front Immunol. 2019 Oct 18;10:2436. doi: 10.3389/fimmu.2019.02436. eCollection 2019. Front Immunol. 2019. PMID: 31681316 Free PMC article. - Forcing switch from short- to intermediate- and long-lived states of the alphaA domain generates LFA-1/ICAM-1 catch bonds.
Chen W, Lou J, Zhu C. Chen W, et al. J Biol Chem. 2010 Nov 12;285(46):35967-78. doi: 10.1074/jbc.M110.155770. Epub 2010 Sep 6. J Biol Chem. 2010. PMID: 20819952 Free PMC article. - A Stable Chemokine Gradient Controls Directional Persistence of Migrating Dendritic Cells.
Quast T, Zölzer K, Guu D, Alvarez L, Küsters C, Kiermaier E, Kaupp UB, Kolanus W. Quast T, et al. Front Cell Dev Biol. 2022 Aug 9;10:943041. doi: 10.3389/fcell.2022.943041. eCollection 2022. Front Cell Dev Biol. 2022. PMID: 36016652 Free PMC article. - SKAP-55, SKAP-55-related and ADAP adaptors modulate integrin-mediated immune-cell adhesion.
Wang H, Rudd CE. Wang H, et al. Trends Cell Biol. 2008 Oct;18(10):486-93. doi: 10.1016/j.tcb.2008.07.005. Epub 2008 Aug 28. Trends Cell Biol. 2008. PMID: 18760924 Free PMC article. Review.
References
- Alonso JL, Essafi M, Xiong JP, Stehle T, Arnaout MA (2002) Does the integrin alphaA domain act as a ligand for its betaA domain? Curr Biol 12: R340–R342 - PubMed
- Beglova N, Blacklow SC, Takagi J, Springer TA (2002) Cysteine-rich module structure reveals a fulcrum for integrin rearrangement upon activation. Nat Struct Biol 9: 282–287 - PubMed
- Carman CV, Springer TA (2003) Integrin avidity regulation: are changes in affinity and conformation underemphasized? Curr Opin Cell Biol 15: 547–556 - PubMed
- Cyster JG (2005) Chemokines, sphingosine-1-phosphate, and cell migration in secondary lymphoid organs. Annu Rev Immunol 23: 127–159 - PubMed
Publication types
MeSH terms
Substances
LinkOut - more resources
Full Text Sources
Miscellaneous


