Antagonism of microRNA-122 in mice by systemically administered LNA-antimiR leads to up-regulation of a large set of predicted target mRNAs in the liver - PubMed (original) (raw)
. 2008 Mar;36(4):1153-62.
doi: 10.1093/nar/gkm1113. Epub 2007 Dec 23.
Morten Lindow, Asli Silahtaroglu, Mads Bak, Mette Christensen, Allan Lind-Thomsen, Maj Hedtjärn, Jens Bo Hansen, Henrik Frydenlund Hansen, Ellen Marie Straarup, Keith McCullagh, Phil Kearney, Sakari Kauppinen
Affiliations
- PMID: 18158304
- PMCID: PMC2275095
- DOI: 10.1093/nar/gkm1113
Antagonism of microRNA-122 in mice by systemically administered LNA-antimiR leads to up-regulation of a large set of predicted target mRNAs in the liver
Joacim Elmén et al. Nucleic Acids Res. 2008 Mar.
Abstract
MicroRNA-122 (miR-122) is an abundant liver-specific miRNA, implicated in fatty acid and cholesterol metabolism as well as hepatitis C viral replication. Here, we report that a systemically administered 16-nt, unconjugated LNA (locked nucleic acid)-antimiR oligonucleotide complementary to the 5' end of miR-122 leads to specific, dose-dependent silencing of miR-122 and shows no hepatotoxicity in mice. Antagonism of miR-122 is due to formation of stable heteroduplexes between the LNA-antimiR and miR-122 as detected by northern analysis. Fluorescence in situ hybridization demonstrated uptake of the LNA-antimiR in mouse liver cells, which was accompanied by markedly reduced hybridization signals for mature miR-122 in treated mice. Functional antagonism of miR-122 was inferred from a low cholesterol phenotype and de-repression within 24 h of 199 liver mRNAs showing significant enrichment for miR-122 seed matches in their 3' UTRs. Expression profiling extended to 3 weeks after the last LNA-antimiR dose revealed that most of the changes in liver gene expression were normalized to saline control levels coinciding with normalized miR-122 and plasma cholesterol levels. Combined, these data suggest that miRNA antagonists comprised of LNA are valuable tools for identifying miRNA targets in vivo and for studying the biological role of miRNAs and miRNA-associated gene-regulatory networks in a physiological context.
Figures
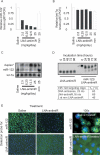
Figure 1.
Silencing of miR-122 in mouse liver by LNA-antimiR. (A, B) Real-time RT-PCR assessment of miR-122 and let-7a levels in LNA-antimiR-treated mice livers. The mice were treated with indicated doses of LNA-antimiR along with a mismatch control (mm) and saline for three consecutive days and sacrificed 24 h after last dose. miR-122 and let-7a levels were normalized to the saline-treated group. Shown are mean and SEM, n = 10. (C) Northern blots were probed with a miR-122 specific probe (upper panel) and re-probed with a let-7a specific probe (lower panel). Two miR-122 bands were detected, a lower band corresponding to mature miR-122 and an upper band to a duplex between the LNA-antimiR and miR-122. (D) The stability of the LNA-antimiR and LNA-antimiR:miR-122 duplex was assessed in mouse plasma at 37°C over 96 h. Shown is a SYBR-Gold stained PAGE. The melting temperature (_T_m) of the LNA-antimiR:miR-122 duplex was measured along with mismatch control and an unmodified DNA oligonucleotide complementary to miR-122. (E) In situ detection of miR-122 and the LNA-antimiR oligonucleotide in the mouse liver sections. Positive in situ hybridization signals for miR-122 and LNA-antimiR, respectively, are visualized in green, while blue depicts DAPI nuclear stain. 100× magnifications reveal subcellular distribution of miR-122 and LNA-antimiR.
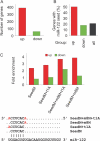
Figure 2.
Enrichment of miR-122 target sites in genes up-regulated after LNA-antimiR treatment. (A) The number of significantly (P < 0.05) up- or down-regulated genes (red and green, respectively) in LNA-antimiR-treated mice livers compared to saline and LNA-mismatch-treated mice. (B) The occurrence of miR-122 6-nt seed sequence matches in differentially expressed genes and in all mouse ENSEMBL annotated genes. (C) Enrichment of different seed types (as shown in lower panel) in up- and down-regulated genes relative to all genes.
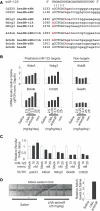
Figure 3.
Expression of four miR-122 targets. (A) Alignment showing the seed matches in Cd320, Ndrg3, AldoA and Bckdk. The 6-nt seed is shown in capital letters, with the m8M or t1A extensions highlighted in red. (B) Real-time RT-PCR analysis of AldoA, Nrdg3, Bckdk and Cd320 was carried out to investigate their expression as response to increasing LNA-antimiR doses. Shown are mean and SD (where n = 3) of mRNA levels relative to the saline control group. Shown is also the mismatch control (mm). (C) miR-122-mediated repression of 3′UTR reporters for AldoA, Ndrg3, Bckdk and Cd320 in HeLa cells. The 3′UTRs of the four predicted miR-122 targets were cloned downstream of the Renilla luciferase gene and the resulting reporters were transfected into HeLa cells along with a miR-122 mimic. Shown are mean values and SD, n = 4. (D) Western blot analysis of AldoA in liver protein extracts of LNA-antimiR-treated and saline control mice. Shown is one representative western blot and corresponding quantification. Values are related to the mean of the saline values (mean and SD, n = 4, asterisk: 75 µg protein instead of 100 µg, compensated for in quantification).
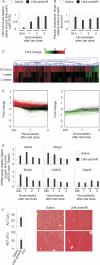
Figure 4.
Duration of functional miR-122 inhibition in LNA-antimiR-treated mice. (A) Real-time RT-PCR analysis of miR-122 levels in LNA-antimiR-treated mice livers over time. The mice were treated with 25 mg/kg/day LNA-antimiR or saline for three consecutive days followed by sacrificing the animals after 24 h, 1, 2 or 3 weeks. miR-122 levels were normalized to the mean of the saline control group at each individual time point. Shown are mean and SD, n = 7 (24 h n = 10). (B) Total plasma cholesterol in LNA-antimiR-treated mice over time. The data were normalized to the saline group at each time point. Shown are mean and SD (n = 7, 24 h n = 10). (C) Hierarchical clustering was performed on the expression profiles of genes identified as differentially expressed between LNA-antimiR and saline-treated mice 24 h, 1 week or 3 weeks post-treatment. The LNA-antimiR/saline log2-transformed expression ratios are indicated by colour where red indicates higher expression level in LNA-antimiR-treated mice compared to saline-treated mice, whereas green indicates lower expression level and black indicates equal expression level. (D) Expression profiles of genes identified as differentially expressed between LNA-antimiR- and saline-treated mice 24 h post-treatment was monitored over time. (E) Temporal expression of four miR-122 target genes (AldoA, Nrdg3, Bckdk and Cd320) and GAPDH in LNA-antimiR-treated mice livers. Values were normalized to saline control at each time point. Shown are mean and SD (n = 3). (F) Toxicity assessed by measuring liver enzymes and investigating liver morphology 24 h after last dose, shown are ALT and AST levels (mean and SD, n = 5) and histology on liver sections.
Similar articles
- LNA-mediated microRNA silencing in non-human primates.
Elmén J, Lindow M, Schütz S, Lawrence M, Petri A, Obad S, Lindholm M, Hedtjärn M, Hansen HF, Berger U, Gullans S, Kearney P, Sarnow P, Straarup EM, Kauppinen S. Elmén J, et al. Nature. 2008 Apr 17;452(7189):896-9. doi: 10.1038/nature06783. Epub 2008 Mar 26. Nature. 2008. PMID: 18368051 - Silencing of microRNAs in vivo with 'antagomirs'.
Krützfeldt J, Rajewsky N, Braich R, Rajeev KG, Tuschl T, Manoharan M, Stoffel M. Krützfeldt J, et al. Nature. 2005 Dec 1;438(7068):685-9. doi: 10.1038/nature04303. Epub 2005 Oct 30. Nature. 2005. PMID: 16258535 - Therapeutic inhibition of the miR-34 family attenuates pathological cardiac remodeling and improves heart function.
Bernardo BC, Gao XM, Winbanks CE, Boey EJ, Tham YK, Kiriazis H, Gregorevic P, Obad S, Kauppinen S, Du XJ, Lin RC, McMullen JR. Bernardo BC, et al. Proc Natl Acad Sci U S A. 2012 Oct 23;109(43):17615-20. doi: 10.1073/pnas.1206432109. Epub 2012 Oct 9. Proc Natl Acad Sci U S A. 2012. PMID: 23047694 Free PMC article. - Positive and negative modulation of viral and cellular mRNAs by liver-specific microRNA miR-122.
Jopling CL, Norman KL, Sarnow P. Jopling CL, et al. Cold Spring Harb Symp Quant Biol. 2006;71:369-76. doi: 10.1101/sqb.2006.71.022. Cold Spring Harb Symp Quant Biol. 2006. PMID: 17381319 Review. - The utility of LNA in microRNA-based cancer diagnostics and therapeutics.
Stenvang J, Silahtaroglu AN, Lindow M, Elmen J, Kauppinen S. Stenvang J, et al. Semin Cancer Biol. 2008 Apr;18(2):89-102. doi: 10.1016/j.semcancer.2008.01.004. Epub 2008 Jan 15. Semin Cancer Biol. 2008. PMID: 18295505 Review.
Cited by
- Molecular Pathogenesis of Ischemic and Hemorrhagic Strokes: Background and Therapeutic Approaches.
Maida CD, Norrito RL, Rizzica S, Mazzola M, Scarantino ER, Tuttolomondo A. Maida CD, et al. Int J Mol Sci. 2024 Jun 7;25(12):6297. doi: 10.3390/ijms25126297. Int J Mol Sci. 2024. PMID: 38928006 Free PMC article. Review. - KSHV-Encoded MicroRNAs: Lessons for Viral Cancer Pathogenesis and Emerging Concepts.
Qin Z, Jakymiw A, Findlay V, Parsons C. Qin Z, et al. Int J Cell Biol. 2012;2012:603961. doi: 10.1155/2012/603961. Epub 2012 Feb 19. Int J Cell Biol. 2012. PMID: 22505930 Free PMC article. - Unmasking Upstream Gene Expression Regulators with miRNA-corrected mRNA Data.
Bollmann S, Bu D, Wang J, Bionaz M. Bollmann S, et al. Bioinform Biol Insights. 2016 May 29;9(Suppl 4):33-48. doi: 10.4137/BBI.S29332. eCollection 2015. Bioinform Biol Insights. 2016. PMID: 27279737 Free PMC article. - The role of miRNAs in cardiovascular disease risk factors.
Jones Buie JN, Goodwin AJ, Cook JA, Halushka PV, Fan H. Jones Buie JN, et al. Atherosclerosis. 2016 Nov;254:271-281. doi: 10.1016/j.atherosclerosis.2016.09.067. Epub 2016 Sep 22. Atherosclerosis. 2016. PMID: 27693002 Free PMC article. Review. - Comprehensive modeling of microRNA targets predicts functional non-conserved and non-canonical sites.
Betel D, Koppal A, Agius P, Sander C, Leslie C. Betel D, et al. Genome Biol. 2010;11(8):R90. doi: 10.1186/gb-2010-11-8-r90. Epub 2010 Aug 27. Genome Biol. 2010. PMID: 20799968 Free PMC article.
References
- Bartel DP. MicroRNAs: genomics, biogenesis, mechanism, and function. Cell. 2004;116:281–297. - PubMed
- Kloosterman WP, Plasterk RH. The diverse functions of microRNAs in animal development and disease. Dev. Cell. 2006;11:441–450. - PubMed
- Johnson SM, Grosshans H, Shingara J, Byrom M, Jarvis R, Cheng A, Labourier E, Reinert KL, Brown D, et al. RAS is regulated by the let-7 microRNA family. Cell. 2005;120:635–647. - PubMed
Publication types
MeSH terms
Substances
LinkOut - more resources
Full Text Sources
Other Literature Sources
Molecular Biology Databases
Research Materials


