Beta-catenin expression results in p53-independent DNA damage and oncogene-induced senescence in prelymphomagenic thymocytes in vivo - PubMed (original) (raw)
Beta-catenin expression results in p53-independent DNA damage and oncogene-induced senescence in prelymphomagenic thymocytes in vivo
Mai Xu et al. Mol Cell Biol. 2008 Mar.
Abstract
The expression of beta-catenin, a potent oncogene, is causally linked to tumorigenesis. Therefore, it was surprising that the transgenic expression of oncogenic beta-catenin in thymocytes resulted in thymic involution instead of lymphomagenesis. In this report, we demonstrate that this is because the expression of oncogenic beta-catenin induces DNA damage, growth arrest, oncogene-induced senescence (OIS), and apoptosis of immature thymocytes. In p53-deficient mice, the expression of oncogenic beta-catenin still results in DNA damage and OIS, but the thymocytes survive and eventually progress to thymic lymphoma. beta-Catenin-induced thymic lymphomas are distinct from lymphomas that arise in p53(-/-) mice. They are CD4(-) CD8(-), while p53-dependent lymphomas are largely CD4(+) CD8(+), and they develop at an earlier age and in the absence of c-Myc expression or Notch1 signaling. Thus, we report that oncogenic beta-catenin-induced, p53-independent growth arrest and OIS and p53-dependent apoptosis protect developing thymocytes from transformation by oncogenic beta-catenin.
Figures
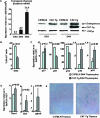
FIG. 1.
Expression of stabilized β-catenin in thymocytes causes growth arrest and cellular senescence. (A) Abundance of human (transgenic) β-catenin mRNA relative to GAPDH in sorted CAT-Tg DN2, DN3, and DN4 cells analyzed by real-time PCR (n = 3). Shown is Western blot analysis of endogenous murine (upper bands) and transgenic human (lower bands) β-catenin protein (representative of data from five mice). (B) BrdU incorporation in electronically gated DN4 thymocytes from C57BL/6 and CAT-Tg mice. The graph shows average data from more than three mice for each genotype in one experiment and is representative of three experiments. (C) Real-time RT-PCR analysis of the expression of cell cycle regulators in sorted DN4 thymocytes from C57BL/6 (n = 3) and CAT-Tg (n = 3) mice. (D) Real-time PCR analysis of SA genes in sorted DN4 thymocytes from C57BL/6 and CAT-Tg mice (n = 3). (D) SA β-galactosidase activity in thymic cryosections from C57BL/6 and CAT-Tg mice (representative of n = 4).
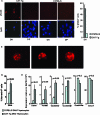
FIG. 2.
Enhanced DNA damage and p53-dependent apoptosis in CAT-Tg mice. (A) Immunofluorescence staining of phosphorylated histone γH2AX in fixed DN (eight CAT-Tg and C57BL/6 mice) and DP (two CAT-Tg and two C57BL/6 mice) thymocytes. The bar graph shows the percentage of γH2AX-positive cells in C57BL/6 DN and CAT-Tg DN thymocytes (see Fig. S3 in the supplemental material). (B) Three examples of γH2AX foci in CAT-Tg DN thymocytes shown at a higher magnification. (C) Annexin V staining of DN4 thymocytes (electronically gated) from C57BL/6 and CAT-Tg mice. The numbers in the graph are an average of data from more than three mice for each genotype in one experiment that is representative of six experiments. (D) Real-time RT-PCR analysis of the expression of p53 pathway-associated genes in sorted DN4 thymocytes from CAT-Tg (n = 3) and C57BL/6 (n = 3) mice.
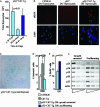
FIG. 3.
Expression of stabilized β-catenin induces p53-independent DNA damage and OIS and p53-dependent apoptosis in thymocytes. (A) Total number of thymocytes in p53−/− CAT-Tg mice at different ages. The first two bars (light blue) represent the initial decrease in thymic cellularity in young mice, and the right bar (dark blue) indicates regained thymic cellularity after 66 days of age. (B) Immunofluorescence staining of γH2AX in fixed DN cells from C57BL/6, p53−/−, and p53−/− CAT-Tg mice. (C) SA β-galactosidase expression in cryosections from a 50-day-old lymphoma-free p53−/− CAT-Tg mouse with a small thymus. (D) Annexin V staining of electronically gated DN4 thymocytes from C57BL/6, CAT-Tg, and lymphoma-free p53−/− CAT-Tg mice (≤65 days old). The data are averages of data from more than three mice for each genotype in one experiment, which is representative of four experiments. (E) BrdU incorporation in electronically gated DN thymocytes from young and lymphoma-free p53−/− CAT-Tg mice (growth arrested) and relatively old lymphoma-bearing p53−/− CAT-Tg mice (proliferating). The graph shows the average of data from more than two mice for each genotype in one experiment and is representative of two experiments. (F) RT-PCR analysis of the expression of cell cycle regulators in sorted DN thymocytes from young lymphoma-free p53−/− CAT-Tg mice (growth arrested) (n = 3) and old lymphoma-bearing p53−/− CAT-Tg mice (proliferating) (n = 3).
FIG. 4.
Stabilized β-catenin in a p53-deficient genetic background causes thymic lymphoma and death of the mice at an early age. (A) Kaplan-Meier plot showing time-to-death latencies in CAT-Tg (n = 10), p53−/− CAT-Tg (n = 14), and p53+/− CAT-Tg (n = 30) mice. Kaplan-Meier plots for p53−/− and p53+/− mice were reported previously (41). The insert indicates the median time to death of mice with various genotypes. (B) Numbers of mice with thymic hyperplasia in a cohort of p53−/− CAT-Tg, p53+/− CAT-Tg, and p53−/− mice. (C) Thymus, spleen, and lymph nodes from diseased p53−/− CAT-Tg mice (70 days old) (left) and C57BL/6 mice (56 days old) (right). (D) Immunohistochemical analysis of CD3ɛ expression (blue) in cryosections of livers from a diseased p53−/− CAT-Tg mouse (84 days old) and a CAT-Tg mouse (84 days old) at 20-fold magnification. (E to G) Thymocytes (E), splenocytes (F), and lymph node cells (G) from C57BL/6 mice (left) and two p53−/− CAT-Tg mice (p53−/− CAT-Tg-1 mice [79 days old] and p53−/− CAT-Tg-2 mice [84 days old] [two right panels]) were stained with antibodies to the TCRβ chain, CD4, and CD8 and analyzed by flow cytometry. Histogram of TCRβ chain expression and dot plots for CD4 and CD8 expression on gated TCRβint/hi splenocytes and lymph node cells are shown.
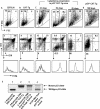
FIG. 5.
Lymphoma progression in p53−/− CAT-Tg mice and loss of p53 function are essential for the formation of β-catenin-triggered DN thymic lymphoma. (A to D) Representative fluorescence-activated cell sorter profiles showing forward scatter (FSC) and side scatter (SSC) (top) and cell surface staining of CD4 and CD8 (middle) and TCRβ (bottom) in electronically gated CD4− CD8− DN cells of total thymocytes from C57BL/6 mice (n > 10) (A), CAT-Tg mice (n > 10) (B), p53−/− CAT-Tg mice (n > 4) at different ages as indicated (C), and p53+/− CAT-Tg mice bearing thymic lymphoma (n > 5). (E) Allele-specific p53 genomic PCR detects normal wild-type and mutant p53 allele (tail) tissues but largely the mutant allele in the thymic lymphoma (representative of three independent thymic lymphomas).
FIG. 6.
p53−/− CAT-Tg DN lymphomas are immature pre-DP cells and are distinct from p53−/− DP/SP lymphomas. (A) Representative fluorescence-activated cell sorter profiles showing forward scatter (FSC) and side scatter (SSC) (top) and cell surface staining of CD4, CD8 (middle), and TCRβ (bottom) on electronically gated CD4− CD8− DN cells of total thymocytes from a thymic lymphoma-bearing 91-day-old p53−/− mouse. (B) Abundance of Deltex-1 and c-Myc mRNA relative to GAPDH in DN thymocytes from C56BL/6 and lymphoma-bearing p53−/− CAT-Tg mice analyzed by real-time PCR. (C) Total thymocytes from C57BL/6 and lymphoma-bearing p53−/−CAT-Tg mice were stained with a group of TCRα antibodies. (Top) Surface expression of TCRα on thymocytes electronically gated to exclude DP, SP, and NK cells. (Bottom) Surface expression of TCRα on electronically gated DP and SP thymocytes. (D) PCR analysis of rearranged TCRαV5H+F3+2C-J2T11 gene segments using the same amount of genomic DNA purified from thymocytes. (E) PCR analysis of rearranged TCRβD2-Jβ2 gene segments using same amount of genomic DNA purified from total thymocytes. (F) Chromosome structural aberrations in p53−/− CAT-Tg lymphomas. From left to right, a normal chromosome 6 (left), a deleted chromosome 6 (right), a chromatid break on chromosome 11, and chromosome translocations illustrated by T(10;17) (left) and T(4;6) (right) are shown; centromere fusions were sometimes simple, containing material from the same chromosome, as in Rb(3.3) on the left, and sometimes more complex, as in Rb[5.T(5;4)] on the right. Polycentric chromosomes resulted from the fusion of chromosomes in a tail-to-tail orientation, as in the dicentric chromosome on the left, or in a head-to-tail orientation, as occurred multiple times in the pentacentric chromosome on the right. (G) Spectral karyotype of p53−/− CAT-Tg lymphomas. The top metaphase is a pseudotetraploid cell (n = 80) with deletions of chromosome 5, a general loss of chromosome 13, and a gain of chromosome 17. Also illustrated at the bottom left side are two chromosome fragments containing centromeres (black arrows). The bottom cell is a pseudotriploid (n = 60) karyotype with a complex rearrangement between chromosomes 10 and 16 containing four centromeres (red arrows).
Similar articles
- Molecular basis for the tissue specificity of β-catenin oncogenesis.
Sharma A, Sen JM. Sharma A, et al. Oncogene. 2013 Apr 11;32(15):1901-9. doi: 10.1038/onc.2012.215. Epub 2012 Jun 11. Oncogene. 2013. PMID: 22689057 Free PMC article. - Deletion of Irf5 protects hematopoietic stem cells from DNA damage-induced apoptosis and suppresses γ-irradiation-induced thymic lymphomagenesis.
Bi X, Feng D, Korczeniewska J, Alper N, Hu G, Barnes BJ. Bi X, et al. Oncogene. 2014 Jun 19;33(25):3288-97. doi: 10.1038/onc.2013.295. Epub 2013 Aug 5. Oncogene. 2014. PMID: 23912454 - p53 and thymic 'death by neglect': thymic epithelial cell-induced apoptosis of CD4+8+ thymocytes is p53-independent.
Rosenheimer-Goudsmid N, Haupt Y, Yefenof E, Zilberman Y, Guy R. Rosenheimer-Goudsmid N, et al. Cell Death Differ. 2000 Mar;7(3):241-9. doi: 10.1038/sj.cdd.4400657. Cell Death Differ. 2000. PMID: 10745269 - DNA-damaging agents induce both p53-dependent and p53-independent apoptosis in immature thymocytes.
MacFarlane M, Jones NA, Dive C, Cohen GM. MacFarlane M, et al. Mol Pharmacol. 1996 Oct;50(4):900-11. Mol Pharmacol. 1996. PMID: 8863836 - Metabolic alterations accompanying oncogene-induced senescence.
Aird KM, Zhang R. Aird KM, et al. Mol Cell Oncol. 2014 Dec 23;1(3):e963481. doi: 10.4161/23723548.2014.963481. eCollection 2014 Jul-Sep. Mol Cell Oncol. 2014. PMID: 27308349 Free PMC article. Review.
Cited by
- Molecular mechanisms underlying hepatocellular carcinoma.
Merle P, Trepo C. Merle P, et al. Viruses. 2009 Dec;1(3):852-72. doi: 10.3390/v1030852. Epub 2009 Nov 9. Viruses. 2009. PMID: 21994573 Free PMC article. - MicroRNA-29 induces cellular senescence in aging muscle through multiple signaling pathways.
Hu Z, Klein JD, Mitch WE, Zhang L, Martinez I, Wang XH. Hu Z, et al. Aging (Albany NY). 2014 Mar;6(3):160-75. doi: 10.18632/aging.100643. Aging (Albany NY). 2014. PMID: 24659628 Free PMC article. - LncRNAs Regulatory Networks in Cellular Senescence.
Puvvula PK. Puvvula PK. Int J Mol Sci. 2019 May 28;20(11):2615. doi: 10.3390/ijms20112615. Int J Mol Sci. 2019. PMID: 31141943 Free PMC article. Review. - The balance of TCF7L2 variants with differential activities in Wnt-signaling is regulated by lithium in a GSK3beta-independent manner.
Struewing I, Boyechko T, Barnett C, Beildeck M, Byers SW, Mao CD. Struewing I, et al. Biochem Biophys Res Commun. 2010 Aug 20;399(2):245-50. doi: 10.1016/j.bbrc.2010.07.062. Epub 2010 Jul 21. Biochem Biophys Res Commun. 2010. PMID: 20654575 Free PMC article. - p53-dependent induction of prostate cancer cell senescence by the PIM1 protein kinase.
Zemskova M, Lilly MB, Lin YW, Song JH, Kraft AS. Zemskova M, et al. Mol Cancer Res. 2010 Aug;8(8):1126-41. doi: 10.1158/1541-7786.MCR-10-0174. Epub 2010 Jul 20. Mol Cancer Res. 2010. PMID: 20647331 Free PMC article.
References
- Bartkova, J., N. Rezaei, M. Liontos, P. Karakaidos, D. Kletsas, N. Issaeva, L. V. Vassiliou, E. Kolettas, K. Niforou, V. C. Zoumpourlis, M. Takaoka, H. Nakagawa, F. Tort, K. Fugger, F. Johansson, M. Sehested, C. L. Andersen, L. Dyrskjot, T. Orntoft, J. Lukas, C. Kittas, T. Helleday, T. D. Halazonetis, J. Bartek, and V. G. Gorgoulis. 2006. Oncogene-induced senescence is part of the tumorigenesis barrier imposed by DNA damage checkpoints. Nature 444633-637. - PubMed
- Braig, M., S. Lee, C. Loddenkemper, C. Rudolph, A. H. Peters, B. Schlegelberger, H. Stein, B. Dorken, T. Jenuwein, and C. A. Schmitt. 2005. Oncogene-induced senescence as an initial barrier in lymphoma development. Nature 436660-665. - PubMed
- Campisi, J. 2001. Cellular senescence as a tumor-suppressor mechanism. Trends Cell Biol. 11S27-S31. - PubMed
Publication types
MeSH terms
Substances
LinkOut - more resources
Full Text Sources
Medical
Molecular Biology Databases
Research Materials
Miscellaneous


