Maturation modulates caspase-1-independent responses of dendritic cells to Anthrax lethal toxin - PubMed (original) (raw)
Maturation modulates caspase-1-independent responses of dendritic cells to Anthrax lethal toxin
Núria Reig et al. Cell Microbiol. 2008 May.
Abstract
Anthrax lethal toxin (LT) contributes to the immune evasion strategy of Bacillus anthracis by impairing the function of cells of the immune system, such as macrophages and dendritic cells (DCs). Macrophages from certain inbred mice strains undergo rapid death upon LT treatment mediated by caspase-1 activation dependent on Nalp1b, an inflammasome component. Rapid LT-induced death is however, not observed in macrophages from human and many mouse strains. Here, we focused on the responses of various murine DCs to LT. Using a variety of knockout mice, we found that depending on the mouse strain, death of bone marrow-derived DCs and macrophages was mediated either by a fast Nalp1b and caspase-1-dependent, or by a slow caspase-1-independent pathway that was triggered by the impairment of MEK1/2 pathways. Caspase-1-independent death was observed in cells of different genetic backgrounds and interestingly occurred only in immature DCs. Maturation, triggered by different types of stimuli, led to full protection of DCs. These studies illustrate that the cellular damage inflicted by LT depends not only on the innate responses but also on the maturation stage of the cell, which modulates the more general caspase-1-independent responses.
Figures
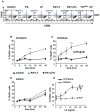
Figure 1. Lethal toxin kills immature DCs
A) B6 immature DCs were treated for 24 h with 500ng/ml PA and 20ng/ml LF, or left untreated (control). Dead and apoptotic cells were detected by FACS after staining with Annexin V-FITC and 7AAD and represented for the gated CD11c+ population. Numbers in the corners of the gates represent the % of cells within the CD11c+ population. Dead cells are 7AAD+/Annexin V+. B) DCs obtained from B6 mice were incubated with different combinations of anthrax toxins and their mutant forms during 24 h. PA (wild type or mutant) was added at 500ng/ml, and LF (wild type or mutant) was added at 20ng/ml. LPS (100ng/ml) was added 8 h before the end of the incubation to the indicated cells (iDC+LPS). Cells were collected and analyzed by flow cytometry after staining with anti CD86-PE and 7AAD. Here is represented the double staining on gated CD11C+ cells treated with medium alone (control), PA alone, LF alone, PA+LF wild type, PA+LFm (inactive mutant E687C) and PASNKE+LF (a furin resistant mutant form of PA). Numbers in each gate correspond to the % of cells within the CD11c+ population. Note the higher 7AAD staining on PA+LF treated cells subsequently treated with LPS (red square) (See Suppl. Fig. 3B for statistical significance). Data from one representative experiment out of 3 is shown.
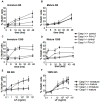
Figure 2. Mature DCs are protected from LT-killing
A) B6 derived DCs were treated during 8 h with 100ng/ml LPS to induce maturation, and subsequently treated with combinations of anthrax toxin and their mutant forms as in Fig. 1B). 7AAD and CD86 staining is represented after 24 h of toxin treatment on the CD11c+ population. Data from one representative experiment (n=3). B,C) DCs obtained from B6 mice were incubated with media, PA+LF or PA+LFmutant (500ng/ml of PA and 20ng/ml of LF or LF E687C mutant) during 4, 8, 16, 24 and 48 h, in the absence (B) or presence (C) of 100 ng/ml LPS during the last 6 h of incubation (or added 30min after the toxins for the 4 h time point). The percentage of dead cells (7AAD positive) on the CD11c+ population at each time point is represented. ***: Treatment with PA+LF during 24 h leads to a significant increase in the % of 7AAD+ cells compared with control cells (p<0.0001 obtained with data from 9 independent experiments done in duplicates or triplicates). D) DCs obtained from B6 mice were incubated with 100ng/ml LPS to induce maturation of the cells. After 8 h, toxins were added as in B–C) and the percentage of 7AAD positive cells on the CD11c+ population after the indicated times of incubation with toxin is represented. No significant difference in the % of 7AAD+ cells is observed between PA+LF and control cells at 24 h (p=0.9 obtained with data from 9 independent experiments done in duplicates or triplicates). E) DCs from B6 mice were matured by 8 h LPS treatment (mature) or left immature and subsequently treated for 24 h with different concentrations of LF (0.1, 1, 20, 200, 500, 1000 and 2000 ng/ml) and PA (500ng/ml or 2000ng/ml for the two higher concentrations of LF). The percentage of 7AAD+ cells on the CD11c+ gated population is represented as mean±SD. Data from 3 independent experiments done in triplicates.
Figure 3. DC susceptibility to LT depends on genetic factors
A) DCs were obtained from 129S mice (type 1 Nalp1b) and were incubated with media or PA+LF (500ng/ml of PA and 20ng/ml of LF) during 2, 4, 16, 24 and 48 h. B) DCs obtained from 129S mice were incubated with 100ng/ml LPS to induce maturation of the cells. After 8 h, toxins were added as in A). The percentage of dead cells (7AAD positive) on the CD11c+ population at each time point is represented. C) DCs from 129S mice were matured by 8 h LPS treatment (mature) or left immature and subsequently treated for 24 h with different concentrations of LF (0.1, 1, 20, 200, 500, 1000 and 2000 ng/ml) and PA (500ng/ml or 2000ng/ml for the two higher concentrations of LF). The percentage of 7AAD+ cells on the CD11c+ gated population is represented as mean±SD. Data from 3 independent experiments done in triplicates.
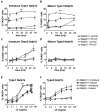
Figure 4. Caspase-1 is involved in rapid but not slow DC death induced by LT
DCs were obtained from Caspase-1−/− mice in B6 (A,B,E) or 129S (C,D,F) background and their parental Caspase-1+/+ B6 and 129S mice. A,C) Immature DCs were incubated with media (control) or 500ng/ml PA and 20ng/ml LF for 2, 4, 16, 24 or 48 hours. B,D) DCs were treated with 100ng/ml LPS for 8 h to induce maturation, and incubated with toxins as in A,C). E,F) DCs were matured by 8 h LPS treatment (mature) or left immature and subsequently treated for 24 h with different concentrations of LF (0.1, 1, 20, 200 and 2000 ng/ml) and PA (500ng/ml or 2000ng/ml for the higher concentration of LF). The percentage of 7AAD+ cells on the CD11c+ gated population is represented as mean±SD. Data from at least 3 independent experiments done in triplicates.
Figure 5. Caspase-1 is not essential for LT induced death on macrophages
Bone marrow derived macrophages were obtained from Caspase-1−/− mice on 129S background and Caspase-1−/− mice on B6 background. Macrophages obtained from bone marrow of the respective Caspase-1+/+ parental strains were used as controls. Cells were treated with different concentrations of LF (0.1, 1, 20, 200 and 2000 ng/ml) and PA (500ng/ml or 2000ng/ml for the higher concentration of LF) during 4 h (A) or 24 h (B). C) Cells were treated for 48 h with media, PA+LF or PA+LFmutant (500ng/ml of PA and 20ng/ml of LF or LF E687C mutant). The percentage of 7AAD+ cells is represented as mean±SEM. Data from 3 independent experiments done in triplicates.
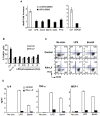
Figure 6. Protection is not linked to differential entry of the toxin
B6 derived DCs were matured over-night with LPS or left immature and a binding assay was performed (A,B): cells were incubated with 500ng/ml of trypsin-nicked PA (Abrami et al., 2003) and 200ng/ml LF, for 1 h on ice. Then washed with toxin free media and transferred at 37°C for different periods of time (in min.). 40 μg of total cell extracts were analyzed by western blotting to detect PA (A), LF processed MEK1 (anti Nterm antibody) and total MEK1 (anti Cterm antibody) (B, see also Suppl. Fig. 4). Equal loading is assessed by an antibody anti-tubulin. B) The amount of intact MEK1 (MEK1 Nterm on Suppl. Fig. 4) was quantified by densitometry, normalized to the amount of total MEK1 (detected with the antibody anti Cterm) as loading control, and the resulting values were normalized to the amount of intact MEK1 (Nterm) at time t=0. The kinetics of decrease of intact MEK1 were compared for immature and mature DCs. Data is expressed as mean±SD from 4 independent experiments. C) DCs from B6 mice were matured by 8 h LPS treatment or left immature, and treated for 24 h with 500ng/ml PA and 20ng/ml LF or LFm (E687C inactive mutant). 40μg of each cell extract were analyzed by western blot with an antibody against the Nterm part of MEK1 to detect only intact MEK1. Equal loading was assessed with an anti-tubulin antibody. An aliquot of the same cells was stained with 7AAD to determine the amount of dead cells by flow cytometry, indicated as % within the CD11c+ population. Blots from one representative experiment (n≥3).
Figure 7. Inhibition of MEK1/2 mimics the effects of LT in DCs
DCs were obtained from B6 mice (A), 129S mice (B) and Caspase-1−/− mice in 129S background (C). DCs were matured by 8 h LPS treatment or left immature and treated for 24 h with 2 μl DMSO (DMSO), 500ng/ml PA and 20ng/ml LF in the presence of DMSO (PA+LF), 5 μM U0126 (MEK1/2 specific inhibitor) (U0126), 20 μM SB203580 (p38 specific inhibitor) (SB) or 5 μM U0126 + 20 μM SB203580 (U+SB). The percentage of 7AAD+ cells on the CD11c+ gated population is represented as mean±SEM. Data from at least 3 independent experiments done in triplicates.
Figure 8. Protection by maturation is independent on maturation stimuli and is achieved at an early maturation stage
A) DCs were obtained from B6 mice and treated (stimulated) or not (unstimulated) with different maturation stimuli for 8 h: LPS (lipopolysaccharide), E. coli (heat inactivated Escherichia coli), B. anth (sonicated extract of Bacillus anthracis), CpG (CpG DNA), PTG (peptidoglycan); or 16 h: GSK3β (inhibitor of GSK3β, SB216763). Toxins were added during 24 h (PA, 500ng/ml and LF, 20ng/ml) and death was measured by flow cytometry of 7AAD staining on the CD11c+ population. Due to the high autoflorescence of the GSK3β inhibitor, death on that condition was measured by Trypan Blue staining on light microscopy on the total cell population. The fold increase in the number of dead cells is represented for each condition with respect to each control (% of dead cells on toxin treated condition divided by % of dead cells on control condition). Data from a representative experiment done in triplicates (n=3) B) DCs were obtained from B6 mice and treated or not with LPS or a sonicated extract of B.anthracis for the indicated times before addition of PA (500ng/ml) and LF (20ng/ml). t0 indicates that the maturation stimuli and the toxin were added simultaneously. The percentage of 7AAD+ cells within the CD11c+ population after 24 h of toxin treatment is indicated as mean±SD. C–D) DCs were obtained from B6 mice and treated (for 24 h) or not with PA (500ng/ml) and LF (20ng/ml) together with LPS or B.anthracis extract or in the absence of maturation stimuli (No stim.) C) Cells were stained for FACS analysis. The double staining with 7AAD and anti-CD86 on the CD11c+ population is represented. Note that toxin treatment only induced death to CD86− (immature) cells. D) Cytokines secreted on the DCs media were measured by FACS using the Cytometric Bead Array system. Data from one representative experiment done in triplicates (n=3).
Figure 9. Nalp3 deficiency differentially affects DC susceptibility to LT
DCs were obtained from Nalp3−/− mice in B6 background, carrying type 1 Nalp1b (Sutterwala et al., 2006)(A,B,E) or type 2 Nalp1b (Mariathasan et al., 2006) (C,D,F) and their controls Nalp3+/+ 129S and B6 mice, respectively. A,C) Immature DCs were incubated with media (control) or 500ng/ml PA and 20ng/ml LF for 2, 4, 16, 24 or 48 hours. B,D) DCs were treated with 100ng/ml LPS for 8 h to induce maturation, and incubated with toxins as in A,C). E,F) DCs were matured by 8 h LPS treatment (mature) or left immature and subsequently treated for 24 h with different concentrations of LF (0.1, 1, 20, 200, 1000 and 2000 ng/ml) and PA (500ng/ml or 2000ng/ml for the two higher concentrations of LF). The percentage of 7AAD+ cells on the CD11c+ gated population is represented as mean±SD. ***: Type 1-Nalp3−/− DCs are significantly more susceptible than Nalp3+/+ control cells, in both conditions of maturation (p≤0.0001 comparing the %7AAD+ cells on Nalp3−/− vs Nalp3+/+ DCs after 24h treatment with PA+LF (20ng/ml)). Data from 3 independent experiments done in triplicates.
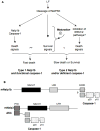
Figure 10. DC susceptibility to LT is modulated by Nalp1b and maturation
A) Model to explain DC responses to LT based on the activation of two death pathways (Nalp1b/caspase-1 dependent or independent) by LT. Survival pathways upregulated upon DC maturation are able to counteract only the Nalp1b/caspase-1 independent pathway. B) Schematic representation of the domain composition of murine Nalp1b and Nalp3 and their interacting proteins. “?”: a direct interaction between mNalp1b and caspase-1 is hypothesized based on data obtained with human Nalp1 (Faustin et al., 2007).
Similar articles
- Depressing time: Waiting, melancholia, and the psychoanalytic practice of care.
Salisbury L, Baraitser L. Salisbury L, et al. In: Kirtsoglou E, Simpson B, editors. The Time of Anthropology: Studies of Contemporary Chronopolitics. Abingdon: Routledge; 2020. Chapter 5. In: Kirtsoglou E, Simpson B, editors. The Time of Anthropology: Studies of Contemporary Chronopolitics. Abingdon: Routledge; 2020. Chapter 5. PMID: 36137063 Free Books & Documents. Review. - Human airway macrophages are metabolically reprogrammed by IFN-γ resulting in glycolysis-dependent functional plasticity.
Cox DJ, Connolly SA, Ó Maoldomhnaigh C, Brugman AAI, Sandby Thomas O, Duffin E, Gogan KM, Ó Gallchobhair O, Murphy DM, O'Rourke SA, O'Connell F, Nadarajan P, Phelan JJ, Gleeson LE, Basdeo SA, Keane J. Cox DJ, et al. Elife. 2024 Dec 2;13:RP98449. doi: 10.7554/eLife.98449. Elife. 2024. PMID: 39620891 Free PMC article. - Enabling Systemic Identification and Functionality Profiling for Cdc42 Homeostatic Modulators.
Malasala S, Azimian F, Chen YH, Twiss JL, Boykin C, Akhtar SN, Lu Q. Malasala S, et al. bioRxiv [Preprint]. 2024 Jan 8:2024.01.05.574351. doi: 10.1101/2024.01.05.574351. bioRxiv. 2024. PMID: 38260445 Free PMC article. Updated. Preprint. - Qualitative evidence synthesis informing our understanding of people's perceptions and experiences of targeted digital communication.
Ryan R, Hill S. Ryan R, et al. Cochrane Database Syst Rev. 2019 Oct 23;10(10):ED000141. doi: 10.1002/14651858.ED000141. Cochrane Database Syst Rev. 2019. PMID: 31643081 Free PMC article. - Undernutrition as a risk factor for tuberculosis disease.
Franco JV, Bongaerts B, Metzendorf MI, Risso A, Guo Y, Peña Silva L, Boeckmann M, Schlesinger S, Damen JA, Richter B, Baddeley A, Bastard M, Carlqvist A, Garcia-Casal MN, Hemmingsen B, Mavhunga F, Manne-Goehler J, Viney K. Franco JV, et al. Cochrane Database Syst Rev. 2024 Jun 11;6(6):CD015890. doi: 10.1002/14651858.CD015890.pub2. Cochrane Database Syst Rev. 2024. PMID: 38860538 Free PMC article. Review.
Cited by
- Cellular and physiological effects of anthrax exotoxin and its relevance to disease.
Lowe DE, Glomski IJ. Lowe DE, et al. Front Cell Infect Microbiol. 2012 Jun 1;2:76. doi: 10.3389/fcimb.2012.00076. eCollection 2012. Front Cell Infect Microbiol. 2012. PMID: 22919667 Free PMC article. Review. - Anthrax lethal toxin triggers the formation of a membrane-associated inflammasome complex in murine macrophages.
Nour AM, Yeung YG, Santambrogio L, Boyden ED, Stanley ER, Brojatsch J. Nour AM, et al. Infect Immun. 2009 Mar;77(3):1262-71. doi: 10.1128/IAI.01032-08. Epub 2009 Jan 5. Infect Immun. 2009. PMID: 19124602 Free PMC article. - The inflammasome in host defense.
Chen G, Pedra JH. Chen G, et al. Sensors (Basel). 2010;10(1):97-111. doi: 10.3390/s100100097. Epub 2009 Dec 28. Sensors (Basel). 2010. PMID: 22315529 Free PMC article. Review. - Anthrax and the inflammasome.
Moayeri M, Sastalla I, Leppla SH. Moayeri M, et al. Microbes Infect. 2012 May;14(5):392-400. doi: 10.1016/j.micinf.2011.12.005. Epub 2011 Dec 17. Microbes Infect. 2012. PMID: 22207185 Free PMC article. Review. - Suppression of dendritic cell activation by anthrax lethal toxin and edema toxin depends on multiple factors including cell source, stimulus used, and function tested.
Chou PJ, Newton CA, Perkins I, Friedman H, Klein TW. Chou PJ, et al. DNA Cell Biol. 2008 Dec;27(12):637-48. doi: 10.1089/dna.2008.0760. DNA Cell Biol. 2008. PMID: 18821847 Free PMC article.
References
- Abrami L, Reig N, van der Goot FG. Anthrax toxin: the long and winding road that leads to the kill. Trends Microbiol. 2005;13(2):72–8. - PubMed
- Agrawal A, Lingappa J, Leppla SH, Agrawal S, Jabbar A, Quinn C, Pulendran B. Impairment of dendritic cells and adaptive immunity by anthrax lethal toxin. Nature. 2003;424(6946):329–34. - PubMed
Publication types
MeSH terms
Substances
LinkOut - more resources
Full Text Sources
Miscellaneous

