Cell- and stimulus-dependent heterogeneity of synaptic vesicle endocytic recycling mechanisms revealed by studies of dynamin 1-null neurons - PubMed (original) (raw)
Cell- and stimulus-dependent heterogeneity of synaptic vesicle endocytic recycling mechanisms revealed by studies of dynamin 1-null neurons
Mitsuko Hayashi et al. Proc Natl Acad Sci U S A. 2008.
Abstract
Mice lacking expression of dynamin 1, a GTPase implicated in the fission reaction of synaptic vesicle endocytosis, fail to thrive and exhibit severe activity-dependent endocytic defects at their synapses. Here, we have used electron tomography to investigate the massive increase in clathrin-coated pit abundance that is selectively observed at a subset of synapses in dynamin 1 KO primary neuron cultures under conditions of spontaneous network activity. This increase, leading to branched tubular plasma membrane invaginations capped by clathrin-coated buds, occurs selectively at inhibitory synapses. A similar massive increase of clathrin-coated profiles (in this case, of clathrin-coated vesicles) is observed at inhibitory synapses of neurons that lack expression of synaptojanin 1, a phosphoinositide phosphatase involved in clathrin-coated vesicle uncoating. Thus, although excitatory synapses are largely spared under these conditions, inhibitory synapses are uniquely sensitive to perturbation of endocytic proteins, probably as a result of their higher levels of tonic activity leading to a buildup of clathrin-coated intermediates in these synapses. In contrast, the predominant endocytic structures observed at the majority of dynamin 1 KO synapses after acute stimulation are endosome-like intermediates that originate by a dynamin 1-independent form of endocytosis. These findings reveal a striking heterogeneity in the mode of synaptic vesicle recycling in different synapses and functional states.
Conflict of interest statement
The authors declare no conflict of interest.
Figures
Fig. 1.
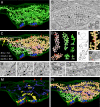
Tomogram and 3D models of a dynamin 1 KO synapse containing an extreme abundance of CCPs. (A) 3D model of the synapse showing SVs and all clathrin-coated structures. SVs are blue spheres, the plasma membrane is outlined by a series of green curves, and red lines indicate selected postsynaptic membranes. The overwhelming majority of coated structures shown in green originate from tubular membranes. (B) Tomographic slice (slice 245 of 432) of the reconstructed volume. Most vesicular profiles are clathrin-coated and appear as buds when viewed in the appropriate tomographic plane (see Inset). A black arrow points to the ER. (C) The independent CCP decorated tubules are depicted in different colors. The numbers summarize the abundance of the indicated structures in this reconstruction. CCVs are shown as pink spheres. (D) Examples of individual reconstructed tubules from the image shown in C. For the green tubules, the site of origin at the plasma membrane is shown. (E) Hypothetical model of how tubules could be generated through the assembly and arrest of clathrin-coated buds on plasma membrane infoldings. (F) Magnification of the boxed region in C demonstrating the presence of another membrane (bright pink) within the large tubule (orange-yellow). (G) Electron micrograph of a structure that may represent the cell surface origin of a tubule such as the one shown in F. Yellow and red arrows represent the plasma membranes of the two adjacent cells. (H–J) Tomographic slices (13-nm intervals) revealing the continuity with the plasma membrane (arrowhead) of a tubular structure (open arrows) decorated with CCPs. (K and L) Tomographic slices of the tubule shown in F revealing the internal membrane (asterisks; see also boxed region in B). (M) 3D modeling of other membranous organelles present in the tomogram: endosome-like structures (yellow) and smooth ER (dark blue). Red arrows point to regions of contact between the ER and the plasma membrane (see also
SI Fig. 6
). (N) A 3D model of the reconstructed nerve terminal volume including all membranous organelles shown (see also
SI Fig. 6
). (Scale bars, 100 nm.)
Fig. 2.
Ultrastructure of synapses enriched in clathrin-coated intermediates from wild-type, dynamin 1 KO, and synaptojanin 1 KO neurons. (A–C) Conventional electron micrographs. Note the abundance of clathrin-coated profiles in B and C and the less dense packing of these structures relative to the packing of SVs (enclosed by dashed red lines). (D–F) 3D models from 250-nm-thick tomograms showing that the bulk of coated profiles (green) are buds in dynamin 1 KO synapses and free vesicles in synaptojanin 1 KO synapses. SVs are shown in blue. (G–I) Tomographic slices (8-nm intervals) of the boxed region in E (an arrowhead indicates the plasma membrane). (J–L) Tomographic slices (17-nm intervals) of the boxed region in F. (Scale bars, 100 nm.)
Fig. 3.
Enhanced clustering of endocytic proteins in the absence of either dynamin 1 or synaptojanin 1. (A) Cortical neurons in culture were fixed and stained by immunofluorescence for the proteins indicated. (Scale bar, 15 μm.) (B) Quantification of the endocytic protein-clustering data. Counted puncta (see Experimental Procedures) were expressed as the number of puncta per 100 μm2 and then normalized for the value of control samples. In the two conditions for which n = 2, the mean ± standard deviation is presented. Elsewhere, the bars show the mean ± SEM of multiple independent experiments (n). The y axis represents the fold of increase of puncta in dynamin 1 KO and synaptojanin KO versus their respective WT control cultures.
Fig. 4.
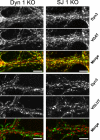
The enhanced clustering of endocytic proteins in dynamin 1 and synaptojanin 1 KO neurons occurs selectively at inhibitory synapses. Dynamin 1 and synaptojanin 1 KO cortical neurons in culture were fixed and stained by immunofluorescence for the indicated proteins. (Scale bars, 10 μm.)
Fig. 5.
Effects of high K+ mediated depolarization on the ultrastructure of dynamin 1 KO synapses. (A) Example of a dynamin 1 KO nerve terminal kept in control medium in which SVs by far predominate despite an abnormal accumulation of CCPs (arrows). (B) Dynamin 1 KO nerve terminal fixed at the end of a 90-sec-long high K+ (90 mM KCl). Note the near absence of SVs, the presence of some CCPs (arrowheads), and the great abundance of vacuoles/endosomes. (C) Dynamin 1 KO synapse incubated with HRP during the high K+ stimulus. (D) Stimulated WT synapse. Vacuoles are present, but SVs are still very abundant. (E) 3D model of a 500-nm-thick volume of a stimulated KO synapse demonstrating SVs (blue spheres), selected postsynaptic membranes (red), endosomes (yellow), and clathrin-coated endocytic intermediates (green). (F) Same image as E, after the subtraction of the endosomes. (Scale bars, A–D, 500 nm; E and F, 100 nm.)
Similar articles
- Synaptojanin and Endophilin Mediate Neck Formation during Ultrafast Endocytosis.
Watanabe S, Mamer LE, Raychaudhuri S, Luvsanjav D, Eisen J, Trimbuch T, Söhl-Kielczynski B, Fenske P, Milosevic I, Rosenmund C, Jorgensen EM. Watanabe S, et al. Neuron. 2018 Jun 27;98(6):1184-1197.e6. doi: 10.1016/j.neuron.2018.06.005. Neuron. 2018. PMID: 29953872 Free PMC article. - A selective activity-dependent requirement for dynamin 1 in synaptic vesicle endocytosis.
Ferguson SM, Brasnjo G, Hayashi M, Wölfel M, Collesi C, Giovedi S, Raimondi A, Gong LW, Ariel P, Paradise S, O'toole E, Flavell R, Cremona O, Miesenböck G, Ryan TA, De Camilli P. Ferguson SM, et al. Science. 2007 Apr 27;316(5824):570-4. doi: 10.1126/science.1140621. Science. 2007. PMID: 17463283 - A dynamin 1-, dynamin 3- and clathrin-independent pathway of synaptic vesicle recycling mediated by bulk endocytosis.
Wu Y, O'Toole ET, Girard M, Ritter B, Messa M, Liu X, McPherson PS, Ferguson SM, De Camilli P. Wu Y, et al. Elife. 2014 Jun 24;3:e01621. doi: 10.7554/eLife.01621. Elife. 2014. PMID: 24963135 Free PMC article. - Sequential steps in clathrin-mediated synaptic vesicle endocytosis.
Brodin L, Löw P, Shupliakov O. Brodin L, et al. Curr Opin Neurobiol. 2000 Jun;10(3):312-20. doi: 10.1016/s0959-4388(00)00097-0. Curr Opin Neurobiol. 2000. PMID: 10851177 Review. - Amphiphysin I and regulation of synaptic vesicle endocytosis.
Wu Y, Matsui H, Tomizawa K. Wu Y, et al. Acta Med Okayama. 2009 Dec;63(6):305-23. doi: 10.18926/AMO/31822. Acta Med Okayama. 2009. PMID: 20035287 Review.
Cited by
- The dynamin-binding domains of Dap160/intersectin affect bulk membrane retrieval in synapses.
Winther ÅM, Jiao W, Vorontsova O, Rees KA, Koh TW, Sopova E, Schulze KL, Bellen HJ, Shupliakov O. Winther ÅM, et al. J Cell Sci. 2013 Feb 15;126(Pt 4):1021-31. doi: 10.1242/jcs.118968. Epub 2013 Jan 15. J Cell Sci. 2013. PMID: 23321638 Free PMC article. - Presynaptic autophagy is coupled to the synaptic vesicle cycle via ATG-9.
Yang S, Park D, Manning L, Hill SE, Cao M, Xuan Z, Gonzalez I, Dong Y, Clark B, Shao L, Okeke I, Almoril-Porras A, Bai J, De Camilli P, Colón-Ramos DA. Yang S, et al. Neuron. 2022 Mar 2;110(5):824-840.e10. doi: 10.1016/j.neuron.2021.12.031. Epub 2022 Jan 21. Neuron. 2022. PMID: 35065714 Free PMC article. - Synaptic vesicle endocytosis: fast and slow modes of membrane retrieval.
Smith SM, Renden R, von Gersdorff H. Smith SM, et al. Trends Neurosci. 2008 Nov;31(11):559-68. doi: 10.1016/j.tins.2008.08.005. Epub 2008 Sep 24. Trends Neurosci. 2008. PMID: 18817990 Free PMC article. Review. - Synaptojanin and Endophilin Mediate Neck Formation during Ultrafast Endocytosis.
Watanabe S, Mamer LE, Raychaudhuri S, Luvsanjav D, Eisen J, Trimbuch T, Söhl-Kielczynski B, Fenske P, Milosevic I, Rosenmund C, Jorgensen EM. Watanabe S, et al. Neuron. 2018 Jun 27;98(6):1184-1197.e6. doi: 10.1016/j.neuron.2018.06.005. Neuron. 2018. PMID: 29953872 Free PMC article. - Ubiquitin-Synaptobrevin Fusion Protein Causes Degeneration of Presynaptic Motor Terminals in Mice.
Liu Y, Li H, Sugiura Y, Han W, Gallardo G, Khvotchev M, Zhang Y, Kavalali ET, Südhof TC, Lin W. Liu Y, et al. J Neurosci. 2015 Aug 19;35(33):11514-31. doi: 10.1523/JNEUROSCI.5288-14.2015. J Neurosci. 2015. PMID: 26290230 Free PMC article.
References
- Jung N, Haucke V. Clathrin-mediated endocytosis at synapses. Traffic. 2007;8(9):1129–1136. - PubMed
- Ryan TA. A pre-synaptic to-do list for coupling exocytosis to endocytosis. Curr Opin Cell Biol. 2006;18:416–421. - PubMed
- Granseth B, Odermatt B, Royle SJ, Lagnado L. Clathrin-mediated endocytosis is the dominant mechanism of vesicle retrieval at hippocampal synapses. Neuron. 2006;51:773–786. - PubMed
- Murthy VN, De Camilli P. Cell biology of the presynaptic terminal. Annu Rev Neurosci. 2003;26:701–728. - PubMed
- Brodin L, Low P, Shupliakov O. Sequential steps in clathrin-mediated synaptic vesicle endocytosis. Curr Opin Neurobiol. 2000;10:312–320. - PubMed
Publication types
MeSH terms
Substances
Grants and funding
- RR-000592/RR/NCRR NIH HHS/United States
- P01 CA046128/CA/NCI NIH HHS/United States
- P30 DA018343/DA/NIDA NIH HHS/United States
- DK45735/DK/NIDDK NIH HHS/United States
- GGP05141/TI_/Telethon/Italy
- CA46128/CA/NCI NIH HHS/United States
- P30 DK045735/DK/NIDDK NIH HHS/United States
- R01 NS036251/NS/NINDS NIH HHS/United States
- DA018343/DA/NIDA NIH HHS/United States
- P41 RR000592/RR/NCRR NIH HHS/United States
- NS36251/NS/NINDS NIH HHS/United States
- R37 NS036251/NS/NINDS NIH HHS/United States
LinkOut - more resources
Full Text Sources
Other Literature Sources
Molecular Biology Databases
Research Materials


