Rheumatoid arthritis synovium contains two subsets of CD83-DC-LAMP- dendritic cells with distinct cytokine profiles - PubMed (original) (raw)
Rheumatoid arthritis synovium contains two subsets of CD83-DC-LAMP- dendritic cells with distinct cytokine profiles
M Cristina Lebre et al. Am J Pathol. 2008 Apr.
Abstract
Dendritic cells (DCs) have been proposed to play a pivotal role in the initiation and perpetuation of rheumatoid arthritis (RA) by presentation of arthritogenic antigens to T cells. We investigated the in vivo characteristics of two major DC subsets, myeloid DCs (mDCs) and plasmacytoid DCs (pDCs), in RA synovial tissue (ST) by measuring their frequency, phenotype, distribution, and cytokine expression. ST was obtained by arthroscopy from 20 RA, 8 psoriatic arthritis, and 10 inflammatory osteoarthritis patients. Levels of CD1c(+) mDCs and CD304(+) pDCs present in ST were quantified by digital image analysis, and their distribution was assessed by double immunolabeling with antibodies against CD3 and CD8. The maturation status and cytokine profile of mDCs and pDCs were quantified by double-immunofluorescence microscopy. In RA patients, the number of CD304(+) pDCs exceeded that of CD1c(+) mDCs, with the majority of infiltrating DCs being CD83(-) or DC-LAMP(-). Synovial pDC numbers were especially increased in RA patients who were positive for rheumatoid factor and anti-citrullinated peptide antibody. mDCs and pDCs were localized adjacent to lymphocyte aggregates. In ST from RA patients, both mDCs and pDCs expressed interleukin (IL)-15. IL-18 and interferon (IFN)-alpha/beta were mainly expressed by pDCs whereas IL-12p70 and IL-23p19 expression was predominant in mDCs. These data characterize the phenotypes of mDCs and pDCs in inflammatory synovitis and define for the first time the cytokine expression profile of these DC subsets.
Figures
Figure 1
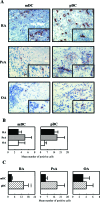
Expression of CD1c (BDCA1)+ mDCs and CD304 (BDCA4)+ pDCs in ST from patients with RA, PsA, and inflammatory OA. A: Representative sections of ST are shown. Insets show high magnification of the CD1c+ mDCs or CD304+ pDCs. Because CD304 is also expressed by endothelial cells, these cells were excluded from the analysis. B: No significant differences were observed between the numbers of both mDCs and pDCs present in RA, PsA, and inflammatory OA synovia. C: In RA synovium the numbers of pDCs are significantly higher compared to mDCs. Results are shown as mean numbers of positive cells/mm2 ± SEM of 20 patients with RA, 8 patients with PsA, and 10 patients with inflammatory OA (B and C). *P < 0.05, **P < 0.01, ***P < 0.001. Original magnifications, ×400.
Figure 2
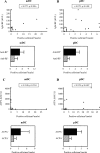
Correlation between mDC and pDC numbers in RA ST to RF (A and B, n = 17) and ACPA serum levels (C and D, n = 13). ST mDC and pDC numbers in RF+/− (positive, n = 16; negative, n = 4) and ACPA+/− (positive, n = 9; negative, n = 4) patients. Data expressed as positive cells/mm2/total nuclei (values are corrected for the global cell infiltration of the synovium, eg, number of nuclei). Spearman rank correlation was used where a P value <0.05 was considered as the level of significance.
Figure 3
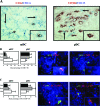
Phenotype and maturation status of mDCs and pDCs in RA synovium. A: Double-immunohistochemistry stainings were performed to investigate the co-expression of CD11c (myeloid marker) or CD123 with CD1c (BDCA1) and CD304 (BDCA4), respectively. CD1c (BDCA1)+ mDCs (red) co-express CD11c (blue) and CD304 (BDCA4)+ pDCs (red) co-express CD123 (blue). A representative double immunostaining of RA synovium from one patient is shown. Insets show high magnification of double-positive CD1c+/CD11c+ mDCs and CD304+/CD123+ pDCs. Arrows show CD11c and CD123 single-positive cells. The percentage of both mDCs and pDCs co-expressing the DC maturation marker CD83 (B) or DC-LAMP (C) in RA synovium did not differ significantly compared to PsA and inflammatory OA synovia. Representative double-immunofluorescence stainings of RA synovium from one patient is shown. CD1c (BDCA1)+ and CD303 (BDCA2)+ DCs are shown in green, CD83+ cells and DC-LAMP+ cells in red, and double-positive cells in yellow. Insets show high magnification of double-positive CD1c+/CD83+ or DC-LAMP+ mDCs and CD303+/CD83+ or DC-LAMP+ pDCs. Original magnifications, ×400.
Figure 4
mDCs and pDCs are localized in lymphocyte aggregates in RA ST. Double-immunohistochemistry stainings were performed to investigate the distribution of CD1c (BDCA1)+ mDCs and CD304 (BDCA4)+ pDCs in relation with CD3- and CD8-positive T cells. Both mDCs and pDCs in RA synovium can be identified in close proximity to clusters of CD3- and CD8-positive cells. A representative double immunostaining of RA synovium from one patient is shown. Original magnifications, ×400.
Figure 5
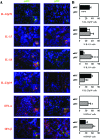
Expression of cytokines by mDCs and pDCs in RA synovium. Double-immunofluorescence stainings were performed to investigate the expression of IL-12p70, IL-15, IL-18, IL-23p19, IFN-α, or IFN-β by CD1c (BDCA1)+ mDCs and CD303 (BDCA2)+ pDCs. A: A representative double-immunofluorescence staining of RA synovium from one patient is shown. CD1c (BDCA1)+ and CD303 (BDCA2)+ DCs are shown in green, cytokines in red, and double-positive cells in yellow. Insets show high magnification of double-positive CD1c+ mDCs or CD303+ pDCs expressing the indicated cytokines. B: Quantification of cytokine expression by mDCs and pDCs. (n = 6, *P < 0.05, **P < 0.01, ***P < 0.001). Data are expressed as the percentage of double-positive cells (corrected for the global cell infiltration of the synovium, eg, number of nuclei). Original magnifications, 400.
Figure 6
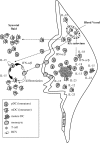
Schematic representation of the proposed model. mDC and pDC migration from the blood circulation into inflamed RA synovium results in their reduced frequency in blood circulation. Because of as yet unknown factors, pDCs are preferentially accumulated in RA synovium compared to mDCs. Within RA synovium, pDC-derived type I IFNs might reach the SF and account for the differentiation of monocytes (that are shed from the synovial lining layer) into mDCs. This event might explain the preferential accumulation of mDCs in the synovial fluid compared to pDCs.
Similar articles
- Enumeration and phenotypical analysis of distinct dendritic cell subsets in psoriatic arthritis and rheumatoid arthritis.
Jongbloed SL, Lebre MC, Fraser AR, Gracie JA, Sturrock RD, Tak PP, McInnes IB. Jongbloed SL, et al. Arthritis Res Ther. 2006;8(1):R15. doi: 10.1186/ar1864. Arthritis Res Ther. 2006. PMID: 16507115 Free PMC article. - Rheumatoid arthritis synovium contains plasmacytoid dendritic cells.
Cavanagh LL, Boyce A, Smith L, Padmanabha J, Filgueira L, Pietschmann P, Thomas R. Cavanagh LL, et al. Arthritis Res Ther. 2005;7(2):R230-40. doi: 10.1186/ar1467. Epub 2005 Jan 11. Arthritis Res Ther. 2005. PMID: 15743469 Free PMC article. - Myeloid Dendritic Cells Are Enriched in Lymph Node Tissue of Early Rheumatoid Arthritis Patients but not in At Risk Individuals.
Ramwadhdoebe TH, Ramos MI, Maijer KI, van Lienden KP, Maas M, Gerlag DM, Tak PP, Lebre MC, van Baarsen LGM. Ramwadhdoebe TH, et al. Cells. 2019 Jul 20;8(7):756. doi: 10.3390/cells8070756. Cells. 2019. PMID: 31330824 Free PMC article. - The function of myeloid dendritic cells in rheumatoid arthritis.
Yu MB, Langridge WHR. Yu MB, et al. Rheumatol Int. 2017 Jul;37(7):1043-1051. doi: 10.1007/s00296-017-3671-z. Epub 2017 Feb 24. Rheumatol Int. 2017. PMID: 28236220 Review. - The role of dendritic cells and their immunometabolism in rheumatoid arthritis.
Suwa Y, Nagafuchi Y, Yamada S, Fujio K. Suwa Y, et al. Front Immunol. 2023 May 12;14:1161148. doi: 10.3389/fimmu.2023.1161148. eCollection 2023. Front Immunol. 2023. PMID: 37251399 Free PMC article. Review.
Cited by
- The synovium in rheumatoid arthritis.
Hitchon CA, El-Gabalawy HS. Hitchon CA, et al. Open Rheumatol J. 2011;5:107-14. doi: 10.2174/1874312901105010107. Epub 2011 Dec 30. Open Rheumatol J. 2011. PMID: 22279509 Free PMC article. - cDC1 are required for the initiation of collagen-induced arthritis.
Ramos MI, Garcia S, Helder B, Aarrass S, Reedquist KA, Jacobsen SE, Tak PP, Lebre MC. Ramos MI, et al. J Transl Autoimmun. 2020 Sep 16;3:100066. doi: 10.1016/j.jtauto.2020.100066. eCollection 2020. J Transl Autoimmun. 2020. PMID: 33015599 Free PMC article. - Efficacy and Safety of Metformin Use in Rheumatoid Arthritis: A Randomized Controlled Study.
Gharib M, Elbaz W, Darweesh E, Sabri NA, Shawki MA. Gharib M, et al. Front Pharmacol. 2021 Sep 22;12:726490. doi: 10.3389/fphar.2021.726490. eCollection 2021. Front Pharmacol. 2021. PMID: 34630103 Free PMC article. - Update on the Pathomechanism, Diagnosis, and Treatment Options for Rheumatoid Arthritis.
Lin YJ, Anzaghe M, Schülke S. Lin YJ, et al. Cells. 2020 Apr 3;9(4):880. doi: 10.3390/cells9040880. Cells. 2020. PMID: 32260219 Free PMC article. Review. - The role of TRPV1 in RA pathogenesis: worthy of attention.
Qu Y, Fu Y, Liu Y, Liu C, Xu B, Zhang Q, Jiang P. Qu Y, et al. Front Immunol. 2023 Sep 8;14:1232013. doi: 10.3389/fimmu.2023.1232013. eCollection 2023. Front Immunol. 2023. PMID: 37744324 Free PMC article. Review.
References
- Chen M, Wang YH, Wang Y, Huang L, Sandoval H, Liu YJ, Wang J. Dendritic cell apoptosis in the maintenance of immune tolerance. Science. 2006;311:1160–1164. - PubMed
- Banchereau J, Briere F, Caux C, Davoust J, Lebecque S, Liu Y-J, Pulendran B, Palucka K. Immunobiology of dendritic cells. Annu Rev Immunol. 2000;18:767–811. - PubMed
- MacDonald KP, Munster DJ, Clark GJ, Dzionek A, Schmitz J, Hart DN. Characterization of human blood dendritic cell subsets. Blood. 2002;100:4512–4520. - PubMed
- Liu Y-J, Kanzler H, Soumelis V, Gilliet M. Dendritic cell lineage, plasticity and cross regulation. Nat Immunol. 2001;2:585–589. - PubMed
Publication types
MeSH terms
Substances
LinkOut - more resources
Full Text Sources
Other Literature Sources
Medical
Research Materials
Miscellaneous
