The signal transducer STAT5 inhibits plasmacytoid dendritic cell development by suppressing transcription factor IRF8 - PubMed (original) (raw)
The signal transducer STAT5 inhibits plasmacytoid dendritic cell development by suppressing transcription factor IRF8
Eiji Esashi et al. Immunity. 2008 Apr.
Abstract
The development of distinct dendritic cell (DC) subsets is regulated by cytokines. The ligand for the FMS-like tyrosine kinase 3 receptor (Flt3L) is necessary for plasmacytoid DC (pDC) and conventional DC (cDC) maturation. The cytokine GM-CSF inhibits Flt3L-driven pDC production while promoting cDC growth. We show that GM-CSF selectively utilized its signal transducer STAT5 to block Flt3L-dependent pDC development from the lineage-negative, Flt3+ (lin- Flt3+) bone-marrow subset. The signaling molecule STAT3, by contrast, was necessary for expansion of DC progenitors but not pDC maturation. In vivo, STAT5 suppressed pDC formation during repopulation of the DC compartment after bone-marrow ablation. GM-CSF-dependent STAT5 signaling rapidly extinguished pDC-related gene expression in lin- Flt3+ progenitors. Inspection of the Irf8 promoter revealed that STAT5 was recruited during GM-CSF-mediated suppression, indicating that STAT5 directly inhibited transcription of this critical pDC gene. Our results therefore show that GM-CSF controls the production of pDCs by employing STAT5 to suppress IRF8 and the pDC transcriptional network in lin- Flt3+ progenitors.
Figures
Figure 1. Cytokine-driven DC differentiation from lin−/Flt3+ bone marrow progenitors
(A) FACS purification of lin−/Flt3+ cells (lin−/PDCA1−/B220−/Flt3+/CD11c−) and pDCs (lin−/PDCA1+/B220+/CD11c+). (B) Post-sorting analysis of purified lin−/Flt3+ cells and pDCs. (C) Lin−/Flt3+ cells were cultured in 100ng/ml Flt3L, 50ng/ml GM-CSF or 100ng/ml Flt3L plus 50ng/ml GM-CSF for 7 d and analyzed by flow cytometry for pDCs (CD11c+/CD11b−/B220+ or CD11c+/CD11b−/PDCA1+ cells) and cDCs (CD11c+/CD11b+ cells). (D) Lin−/Flt3+ cells were labeled with CFSE, cultured for 3 d and analyzed by flow cytometry. (E) pDCs were cultured for 7 d (antibody stain) or 3 d (CFSE stain) prior to analysis.
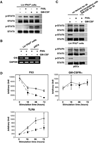
Figure 2. Flt3L- and GM-CSF-responsive STAT activation and gene expression in Lin−/Flt3+ cells
(A) Lin−/Flt3+ cells were incubated without exogenous cytokine for 4 h, then stimulated with Flt3L (100ng/ml), GM-CSF (50ng/ml) or Flt3L (100ng/ml) and GM-CSF (50ng/ml) for 20 min, as indicated. Activated and total STAT protein levels were determined by immunoblotting. (B) Lin−/Flt3+ cells and pDCs were stimulated with Flt3L −/+ GM-CSF for 30 min. Expression of CIS and GAPDH was determined by RT-PCR. (C) Lin−/Flt3+ cells and pDCs were incubated −/+ GM-CSF for 4 h, then stimulated with Flt3L or maintained in GM-CSF alone for an additional 20 min. Activated and total STAT protein levels were assessed by immunoblotting. (D) Lin−/Flt3+ progenitors were stimulated with Flt3L (open circles) or Flt3L and GM-CSF (black circles) for 0, 16, 36 or 72 h. Gene expression was determined by quantitative PCR.
Figure 3. Flt3L- and GM-CSF-dependent DC development from STAT3-deficient bone marrow and lin−/Flt3+ progenitors
(A) 2 × 10⁶ bone marrow cells from STAT3-deficient (STAT3KO) and wild type (WT) mice were cultured in Flt3L, GM-CSF or Flt3L plus GM-CSF for 7 d and cell numbers were determined by enumeration. The data represent mean values ± SD from three independent experiments. Error bars indicate SD. (B) Bone marrow cells were stained with CFSE, cultured as indicated for 3 d and analyzed by flow cytometry. (C, D) Bone marrow cells were cultured as indicated for 7 d; pDC (CD11c+/CD11b−/PDCA1+) and cDC (CD11c+/CD11b+) frequencies and absolute numbers were determined. Error bars indicate SD. (E) Lin−/Flt3+ cells were cultured for 7 d; pDC and cDC frequencies were analyzed. (F) WT and STAT3-deficient pDCs were isolated from fresh bone marrow samples by FACS, or following ex vivo differentiation in Flt3L (7 d). pDCs (4 × 10⁴/100µl) were stimulated with 5µM CpG-A or left untreated for 24 h. IFNα production was determined by ELISA.
Figure 4. Cytokine-driven DC development from STAT5−/− fetal liver cells
1 × 10⁶ FL (E14.5) cells were cultured in 100ng/ml Flt3L −/+ 50ng/ml GM-CSF for 7 d. (A) Total cell number in each culture was determined by enumeration. Error bars indicate SD. (B) pDC (CD11c+/CD11b−/PDCA1+) and cDC (CD11c+/CD11b+) frequencies are shown. (C) Absolute numbers of pDCs, cDCs and CD11c+/CD11b− DCs (CD11b− DCs) were determined. The data represent mean values ± SD from three independent experiments.
Figure 5. Development of pDCs and cDCs from STAT5−/− fetal liver progenitors in vivo
(A, D) Left panels: The frequency of donor-derived CD45.2+ cells in the bone marrow or spleen of WT and STAT5KO transplant recipients was determined. Second column: The percentage of CD11c+/CD11b−, CD11c+/CD11b+ and CD11c−/CD11b+ cells within the bone marrow or spleen CD45.2+ subset from WT and STAT5KO recipients are shown. The CD45.2+/CD11c+/CD11b− (R1, boxed) and CD45.2+/CD11c+/CD11b+ (R2, boxed) subsets were analyzed for PDCA1 expression. Levels of donor-derived pDCs (CD45.2+/CD11c+/CD11b−/PDCA1+ cells), cDCs (CD45.2+/CD11c+/CD11b+ cells, which are negative for PDCA1) and CD11b− DCs (CD45.2+/CD11c+/CD11b−/PDCA1−) from a representative experiment are shown. (B, E) Relative levels of pDCs, CD11b− DCs and cDCs within the donor-derived CD45.2+/CD11c+ DC population in the bone marrow or spleen of WT and STAT5KO recipient mice were determined. The data represent individual (open circles) and mean (bar) values for STAT5+/+ or STAT5−/− chimeric mice (n=8/genotype) from 2 independent experiments. P values determined by unpaired two-tailed Student’s t test are indicated. (C) pDCs were recovered from STAT5KO (black bars) and WT (white bars) recipient mice by FACS; cells were stimulated with CpG-A (5µM) and IFNα production was measured. The data represent mean values ± SD from two independent experiments. (F) The donor-derived CD45.2+ population from the spleen of WT and STAT5KO transplant recipient mice was analyzed for CD11chi/CD4+/CD11b+, CD11chi/CD8α+ and CD11chi/CD8α− DC subsets by flow cytometry.
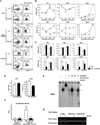
Figure 6. STAT5 function in DC development and gene expression
Donor-derived CD45.2+/lin−/Flt3+ progenitor cells were recovered from the bone marrow of STAT5+/+ (WT) and STAT5−/− (STAT5KO) transplant recipient mice by FACS. (A) CD45.2+/lin−/Flt3+ cells were cultured as indicated for 7 d; pDC (CD11c+/CD11b−/PDCA1+) and cDC (CD11c+/CD11b+) levels were determined. (B) STAT5+/+ CD45.2+/lin−/Flt3+ cells were cultured for 0, 16, 36 or 72 hours in Flt3L (solid line, open circles) or Flt3L plus GM-CSF (hatched line, black circles). Real-time PCR was used to determine transcription factor expression levels. (C) CD45.2+/lin−/Flt3+ cells from WT and STAT5KO recipient mice were cultured in Flt3L (white bars) or Flt3L plus GM-CSF (black bars) for 36 h. Transcription factor expression levels were determined by real time PCR. Error bars represent SD. (D) D2SC/1 cells were stimulated with GM-CSF or left untreated for 120 min; expression of IRF4 and IRF8 mRNA was measured by real time PCR. Error bars represent SD. (E) D2SC/1 cells stably expressing STAT5a were stimulated with GM-CSF or left untreated for 30 min. Nuclear extracts were recovered and used in EMSAs with or without STAT5 supershift antibody or competitor oligonucleotides (D, IRF8 STAT site; mD, mutated IRF8 STAT site; S5, β-casein STAT site; P, IRF8 STAT-like site). GM-CSF-responsive STAT5 DNA binding and STAT5 antibody supershift complexes are indicated (open and closed stars, respectively). (F) Luciferase assays were performed as described in the Experimental Procedures. Error bars represent SD. (G) D2SC/1 cells were stimulated with GM-CSF for 60 min or left untreated. Chromatin immunoprecipitations were performed with anti-STAT5 antibodies (STAT5) or an irrelevant IgG (IgG). PCR reactions were performed, using primers specific for the murine IRF4 and IRF8 promoters, on total cell lysates (input) or immunoprecipitation samples, as indicated. PCR reactions were visualized by ethidium bromide staining of agarose gels.
Comment in
- The STATs on dendritic cell development.
Onai N, Manz MG. Onai N, et al. Immunity. 2008 Apr;28(4):490-2. doi: 10.1016/j.immuni.2008.03.006. Immunity. 2008. PMID: 18400192 Review.
Similar articles
- The signal transducers STAT5 and STAT3 control expression of Id2 and E2-2 during dendritic cell development.
Li HS, Yang CY, Nallaparaju KC, Zhang H, Liu YJ, Goldrath AW, Watowich SS. Li HS, et al. Blood. 2012 Nov 22;120(22):4363-73. doi: 10.1182/blood-2012-07-441311. Epub 2012 Oct 1. Blood. 2012. PMID: 23033267 Free PMC article. - The concerted action of GM-CSF and Flt3-ligand on in vivo dendritic cell homeostasis.
Kingston D, Schmid MA, Onai N, Obata-Onai A, Baumjohann D, Manz MG. Kingston D, et al. Blood. 2009 Jul 23;114(4):835-43. doi: 10.1182/blood-2009-02-206318. Epub 2009 May 22. Blood. 2009. PMID: 19465690 - Introduction of Human Flt3-L and GM-CSF into Humanized Mice Enhances the Reconstitution and Maturation of Myeloid Dendritic Cells and the Development of Foxp3+CD4+ T Cells.
Iwabuchi R, Ikeno S, Kobayashi-Ishihara M, Takeyama H, Ato M, Tsunetsugu-Yokota Y, Terahara K. Iwabuchi R, et al. Front Immunol. 2018 May 28;9:1042. doi: 10.3389/fimmu.2018.01042. eCollection 2018. Front Immunol. 2018. PMID: 29892279 Free PMC article. - Mechanisms regulating dendritic cell specification and development.
Watowich SS, Liu YJ. Watowich SS, et al. Immunol Rev. 2010 Nov;238(1):76-92. doi: 10.1111/j.1600-065X.2010.00949.x. Immunol Rev. 2010. PMID: 20969586 Free PMC article. Review. - Estrogen receptors regulate an inflammatory pathway of dendritic cell differentiation: mechanisms and implications for immunity.
Kovats S. Kovats S. Horm Behav. 2012 Aug;62(3):254-62. doi: 10.1016/j.yhbeh.2012.04.011. Epub 2012 Apr 25. Horm Behav. 2012. PMID: 22561458 Free PMC article. Review.
Cited by
- Stiffness regulates dendritic cell and macrophage subtype development and increased stiffness induces a tumor-associated macrophage phenotype in cancer co-cultures.
Guenther C. Guenther C. Front Immunol. 2024 Aug 15;15:1434030. doi: 10.3389/fimmu.2024.1434030. eCollection 2024. Front Immunol. 2024. PMID: 39211033 Free PMC article. - Advances in understanding of dendritic cell in the pathogenesis of acute kidney injury.
Lv D, Jiang H, Yang X, Li Y, Niu W, Zhang D. Lv D, et al. Front Immunol. 2024 Feb 16;15:1294807. doi: 10.3389/fimmu.2024.1294807. eCollection 2024. Front Immunol. 2024. PMID: 38433836 Free PMC article. Review. - JAK/STAT pathway: Extracellular signals, diseases, immunity, and therapeutic regimens.
Hu Q, Bian Q, Rong D, Wang L, Song J, Huang HS, Zeng J, Mei J, Wang PY. Hu Q, et al. Front Bioeng Biotechnol. 2023 Feb 23;11:1110765. doi: 10.3389/fbioe.2023.1110765. eCollection 2023. Front Bioeng Biotechnol. 2023. PMID: 36911202 Free PMC article. Review. - CTCF controls three-dimensional enhancer network underlying the inflammatory response of bone marrow-derived dendritic cells.
Yang B, Kim S, Jung WJ, Kim K, Kim S, Kim YJ, Kim TG, Lee EC, Joo JS, Park CG, Oh S, Yoo KH, Kim HP. Yang B, et al. Nat Commun. 2023 Mar 8;14(1):1277. doi: 10.1038/s41467-023-36948-5. Nat Commun. 2023. PMID: 36882470 Free PMC article. - Bone marrow Adipoq-lineage progenitors are a major cellular source of M-CSF that dominates bone marrow macrophage development, osteoclastogenesis, and bone mass.
Inoue K, Qin Y, Xia Y, Han J, Yuan R, Sun J, Xu R, Jiang JX, Greenblatt MB, Zhao B. Inoue K, et al. Elife. 2023 Feb 13;12:e82118. doi: 10.7554/eLife.82118. Elife. 2023. PMID: 36779851 Free PMC article.
References
- Anderson KL, Perkin H, Surh CD, Venturini S, Maki RA, Torbett BE. Transcription factor PU.1 is necessary for development of thymic and myeloid progenitor-derived dendritic cells. J. Immunol. 2000;164:1855–1861. - PubMed
- Asselin-Paturel C, Boonstra A, Dalod M, Durand I, Yessaad N, Dezutter-Dambuyant C, Vicari A, O'Garra A, Biron C, Briere F, Trinchieri G. Mouse type I IFN-producing cells are immature APCs with plasmacytoid morphology. Nat Immunol. 2001;2:1144–1150. - PubMed
- Banchereau J, Steinman RM. Dendritic cells and the control of immunity. Nature. 1998;392:245–252. - PubMed
- Cella M, Jarrossay D, Facchetti F, Alebardi O, Nakajima H, Lanzavecchia A, Colonna M. Plasmacytoid monocytes migrate to inflamed lymph nodes and produce large amounts of type I interferon. Nat Med. 1999;5:919–923. - PubMed
Publication types
MeSH terms
Substances
Grants and funding
- R01 AI059718-04/AI/NIAID NIH HHS/United States
- R01 AI059718-01A1/AI/NIAID NIH HHS/United States
- R21 AI073587-01/AI/NIAID NIH HHS/United States
- R01 AI059718-03/AI/NIAID NIH HHS/United States
- R21 AI073587/AI/NIAID NIH HHS/United States
- R01 AI059718/AI/NIAID NIH HHS/United States
- R01 AI059718-02/AI/NIAID NIH HHS/United States
LinkOut - more resources
Full Text Sources
Molecular Biology Databases
Miscellaneous


