Trophoblast differentiation defect in human embryonic stem cells lacking PIG-A and GPI-anchored cell-surface proteins - PubMed (original) (raw)
Trophoblast differentiation defect in human embryonic stem cells lacking PIG-A and GPI-anchored cell-surface proteins
Guibin Chen et al. Cell Stem Cell. 2008.
Abstract
Pluripotent human embryonic stem (hES) cells can differentiate into various cell types derived from the three embryonic germ layers and extraembryonic tissues such as trophoblasts. The mechanisms governing lineage choices of hES cells are largely unknown. Here, we report that we established two independent hES cell clones lacking a group of cell surface molecules, glycosyl-phosphatidyl-inositol-anchored proteins (GPI-APs). The GPI-AP deficiency in these two hES clones is due to the deficiency in the gene expression of PIG-A (phosphatidyl-inositol-glycan class A), which is required for the first step of GPI synthesis. GPI-AP-deficient hES cells were capable of forming embryoid bodies and initiating cell differentiation into the three embryonic germ layers. However, GPI-AP-deficient hES cells failed to form trophoblasts after differentiation induction by embryoid body formation or by adding exogenous BMP4. The defect in trophoblast formation was due to the lack of GPI-anchored BMP coreceptors, resulting in the impairment of full BMP4 signaling activation in the GPI-AP-deficient hES cells. These data reveal that GPI-AP-enhanced full activation of BMP signaling is required for human trophoblast formation.
Figures
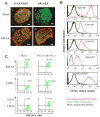
Fig 1. Analyses of two hES cell clones lacking GPI-anchored proteins (GPI-APs)
After aerolysin selection, G-GFP derived hES cells that lacked GPI-APs were sorted and expanded. 6 clones were obtained from two large-scale experiments. Two (AR1-c1 and AR2-c1) were further characterized since they can form undifferentiated colonies (Supplement Table S2). (A). Cell surface staining for alkaline phosphatase (APase). The AR1-c1 or its parental G-GFP hES cells (both constitutively expressing GFP) were cultured under a feeder-free condition and fixed before cell surface staining. Mouse monoclonal IgG recognizing either the APase (i and ii) or SSEA-4 (iii and iv) was used as primary antibodies. Then Alexa 555-conjugated antibodies recognizing anti-mouse IgG were used to light up detected antigens. The micrographic images of stained were superimposed with that of cellular GFP signals. While both APase and SSEA4 were detected on cell surface of G-GFP cells (i and iii), only SSEA-4 (iv) but not the APase (ii) was detected on AR1-c1 cells. (B). Flow cytometric analysis of other GPI-APs such as CD90, CD55, CD59 and Cripto using PE-conjugated specific IgGs. The red lines represent staining profiles of the G-GFP control whereas the green lines represent the AR1-c1 hES cells. The black lines represent the background staining (using an irrelevant antibodies). The both hES cell types expressed a high level of surface marker SSEA3. (C). Similar analysis of the AR2-c1 hES cell clone before or after transduction by a lentiviral vector expressing a PIG-A transgene. AR2-c1 cells express SSEA4, but lack CD90, CD55 or CD59. After one round of transduction, ∼80% AR2-c1 cells stably expressed GPI-APs.
Fig 2. Analysis of PIG-A gene expression in human ES cells lacking GPI-APs
(A). Conventional RT-PCR of the PIG-A gene expression in undifferentiated ES cells (undiff. ES) and differentiated hES cells after BMP4 induction or embryoid body formation (EB) after 10 days. G-GFP hES cells (samples 1) and AR1-c1 (samples 2) clonal hES cells were analyzed side by side. In addition, we analyzed reconstituted AR1-c1 hES cells after transduction of PIG-A transgene that restored GPI-AP expression (samples 3). (B). Similar analysis of AR2-c1 hES cells (sample 4) and the AR2-c1 cells restored by the PIG-A transgene expression (sample 5). (c) Quantitative RT-PCR analysis of the PIG-A gene in AR1-c1 hES cells before and after differentiation. The relative level of PIG-A mRNA is first normalized by that of beta-actin, and then by the level in teratoma (defined as 100), which was used as a common positive control in quantitative RT-PCR analyses. The mean and SD (n=4) were plotted in a log scale. The PIG-A mRNA in undifferentiated G-GFP cells is found at a low level (1-2% of teratoma), but elevated significantly after differentiation by BMP4 induction or EB formation (A and C-D). Notably, the PIG-A mRNA level in undifferentiated AR1-c1 hES cells (sample 2) and AR2-c1 (sample 4) was much lower (∼ 10 fold) than the control G-GFP cells by both assays in (A-C). The deficiency of PIG-A mRNA in AR1-c1 cells is more obvious after differentiation (A, C). (D). Northern blot of PIG-A mRNA in AR1-c1 cells confirmed RT-PCR data that the PIG-A deficiency is due to the lack of PIG-A mRNA.
Fig 3. Embryoid body (EB) formation and differentiation from the parental (G-GFP) and two independent PIG-A/GPI-AP deficient hES cell clones
(A). Three ES cell types were cultured in suspension as aggregates to form EBs. The morphology and numbers of EBs were monitored daily for 15 days. The EB morphology is better illustrated by constitutively-expressed GFP signal. The rate as well as morphology of EBs by 3 hES cell types was similar. (B). Confirmation of the GPI-AP deficiency in EB-derived cells. Antibodies recognizing CD55 and CD59, were mixed and used to stain single cell suspension. (C). RT-PCR analysis of marker gene expression before and after EB formation at day 10. As expected, Nanog expression in G-GFP control cells (samples 1) is high in undifferentiated ES cells (undiff. ES) and visibly reduced after spontaneous differentiation by EB formation (EB). The gene expression of differentiated markers such as AFP (endoderm), CD34 (mesoderm), MSI 1 and PAX6 (ectoderm) were significantly elevated as compared to undifferentiated ES cells. AR1-c1 (samples 2) showed similar pattern to the G-GFP control, so did the AR1-c1 cells expressing PIG-A transgene (samples 3). (D). RT-PCR analysis of a marker gene expression for trophectoderm. hCGα expression from AR1-c1 hES cells (samples 2) failed to elevate after EB formation, but restored by PIG-A transgene expression. See more data by real-time quantitative RT-PCR in Supplement Fig S3.
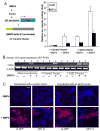
Fig 4. BMP4 induced trophoblast differentiation of normal G-GFP hES cells, but not AR1-c1 hES cells lacking GPI-APs
The parental (G-GFP) and AR1-c1 hES cells were cultured under a feeder-free condition and treated with BMP4 (50 ng/ml) for 10 days. Then cells were harvested for RT-PCR analyses (A and B) after the conditioned medium was collected and used to detect hCG hormone by ELISA (C). (A). Quantitative RT-PCR for trophoblast markers such as hCGα, hCGβ and CDX2. * undetectable as in undifferentiated hES cells after 40 cycle PCR. Profiles of the gene expression of other markers (such as NANOG, AFP, CD34 and PAX6) after BMP4 induction are shown in Supplement Fig S3. (C). Conventional RT-PCR using a different primer set for hCGα (as in Fig 3D) and a specific primer set for PIG-A as in Fig 2A. RNA from undifferentiated ES cells (undiff. ES) or after BMP4 induction (BMP4 induced) from either G-GFP (samples 1) or AR1-c1 (samples 2) hES cells was used. In addition, we also included AR1-c1 derivatives in which a PIG-A transgene is expressed (samples 3) in this experiment. (D). immuno-fluorescent staining for trophectoderm markers placenta-cadherin (upper row, i-ii) and TROMA-I (lower row, iii-iv) from the differentiated G-GFP (left) and AR1-c1 cells (right), 11 days after BMP4 induction. The presence of antigen is visualized by anti-mouse IgG conjugated with Alexa 595 (red) and nuclei were stained by DAPI (blue). While the trophectoderm marker induction is obvious in the differentiated G-GFP cells, it is much lower in the GPI-AP deficient AR1-c1 cell population.
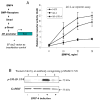
Fig 5. BMP signaling activation is significantly reduced in AR1-c1 hES cells due to the PIG-A and GPI-AP deficiency
(A). BMP4 signaling activation in G-GFP or AR1-c1 hES cells was measured by a Luciferase reporter (_Id1_-Luc) controlled by the Id1 gene promoter. Six hours after transfection of the reporter plasmid, cells were stimulated with various concentration of BMP4 for 20 hours and harvested. The _Id1_-Luc activity was measured, normalized, and calculated relative to that of G-GFP without BMP4 stimulation (defined as 1). The normalized mean and SD (n≥5) were plotted. In one experiment, the Id1-Luc activity in AR1-c1 hES cells that have been transduced with PIG-A transgene was also measured before and after BMP induction (n=5). Combined from two experiments (Σn=7), the mean of the reconstituted AR1-c1/PIG-A cells is statistically greater than the AR1-c1 cells (p<0.05) and insignificant from G-GFP hES cells (p>0.05). (B). Western blot to detect the phosphorylated (activated) form of 3 highly related SMAD proteins (1/5/8) without or with BMP4 induction. G-GFP (1) or AR1-c1 (2) hES cells were treated with BMP4 for 6 hours, and cell lysates were analyzed by Western blotting, using purified specific antibodies recognizing the phosphorylated SMAD1/5/8. After stripping, the blot was re-probed by a specific antibody recognizing the housekeeping protein GAPDH.
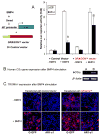
Fig 6. Transient transfection of an activated BMP-RI (ALK3) gene restored the BMP signaling and trophoblast formation
(A). G-GFP or AR1-c1 hES cells were transfected with an activated ALK3 gene or control vector, together with the Id1-luciferase reporter plasmid and the EF.lacZ as in Fig 5a. Six hours after transfection, cells were stimulated in the absence (-) or presence (+) of BMP4 (50 ng/ml) for 20 hours and harvested. The Id1-luciferase activity was measured, normalized by the lacZ activity, and calculated relative to the level without BMP4 stimulation (defined as 1) for either G-GFP or AR1-c1 hES cells. The normalized mean and SD values from 3 independent experiments were combined and plotted (Σn=8). The difference of the ALK3-transfected, BMP4 activated AR1-c1 cells vs. any of other 3 AR1-c1 groups is significant (p<0.05). (B). Human CGα gene expression in AR1-c1 cells after ALK3 transfection and BMP4 stimulation. G-GFP (samples 1) or AR1-c1 (samples 2) hES cells in pair were transfected with the activated ALK3 gene or control vector at day 0 for six hours, and treated in the absence or presence of BMP4 (50 ng/ml) for 2 days. Two days after, the same treatment was repeated. After a total of 5 days, various types of transfected cells were either harvested for RT-PCR (b) or fixed for immuno-staining (c). Human hCGα gene expression was measured by RT-PCR as in Fig 3d and Fig 4b. (C). TROMA-I staining of the double-transfected hES cells at day 5 as in (b). Scale bar: 50 μm.
Fig 7. Transient transfection of a transmembrane form of DRAGON restored the BMP signaling activation and trophoblast formation
(A). G-GFP or AR1-c1 hES cells were transfected with the engineered DRAGON™ vector or the control pDisplay vector, together with the _Id1_-luciferase reporter plasmid and the EF.lacZ as in Fig 6a. Six hours after transfection, cells were stimulated in the absence (-) or presence (+) of BMP4 for 20 hours and harvested. The Id1-luc activity was measured, normalized by the lacZ activity, and calculated relative to the level without BMP4 stimulation (defined as 1) for each cell type. The normalized mean and SD values (n=4) were plotted. The difference between Samples A and B is significant (p<0.05). (B). Human CGα gene expression in AR1-c1 cells after DRAGON™ transfection and BMP4 stimulation. G-GFP (samples 1) or AR1-c1 (samples 2) hES cells in pair were transfected with the DRAGON™ or control vector at day 0 for six hours, and treated in the absence or presence of BMP4 (50 ng/ml) for 2 days. Two days after, the same treatment was repeated. After a total of 5 days, various types of transfected cells were either harvested for RT-PCR (B) or fixed for TROMA-I immuno-staining (C). Scale bar: 50 μm.
Similar articles
- Generation of glycosylphosphatidylinositol anchor protein-deficient blood cells from human induced pluripotent stem cells.
Yuan X, Braunstein EM, Ye Z, Liu CF, Chen G, Zou J, Cheng L, Brodsky RA. Yuan X, et al. Stem Cells Transl Med. 2013 Nov;2(11):819-29. doi: 10.5966/sctm.2013-0069. Epub 2013 Oct 10. Stem Cells Transl Med. 2013. PMID: 24113066 Free PMC article. - BMP10 as a potent inducer of trophoblast differentiation in human embryonic and induced pluripotent stem cells.
Lichtner B, Knaus P, Lehrach H, Adjaye J. Lichtner B, et al. Biomaterials. 2013 Dec;34(38):9789-802. doi: 10.1016/j.biomaterials.2013.08.084. Epub 2013 Sep 23. Biomaterials. 2013. PMID: 24070570 - Improved efficiency and pace of generating induced pluripotent stem cells from human adult and fetal fibroblasts.
Mali P, Ye Z, Hommond HH, Yu X, Lin J, Chen G, Zou J, Cheng L. Mali P, et al. Stem Cells. 2008 Aug;26(8):1998-2005. doi: 10.1634/stemcells.2008-0346. Epub 2008 May 29. Stem Cells. 2008. PMID: 18511599 - Trophoblast differentiation of human embryonic stem cells.
Tiruthani K, Sarkar P, Rao B. Tiruthani K, et al. Biotechnol J. 2013 Apr;8(4):421-33. doi: 10.1002/biot.201200203. Epub 2013 Jan 17. Biotechnol J. 2013. PMID: 23325630 Review. - Embryonic stem cell-derived trophoblast differentiation: a comparative review of the biology, function, and signaling mechanisms.
Giakoumopoulos M, Golos TG. Giakoumopoulos M, et al. J Endocrinol. 2013 Feb 25;216(3):R33-45. doi: 10.1530/JOE-12-0433. Print 2013 Mar. J Endocrinol. 2013. PMID: 23291503 Free PMC article. Review.
Cited by
- Glycosylphosphatidylinositol biosynthesis and remodeling are required for neural tube closure, heart development, and cranial neural crest cell survival.
Lukacs M, Roberts T, Chatuverdi P, Stottmann RW. Lukacs M, et al. Elife. 2019 Jun 24;8:e45248. doi: 10.7554/eLife.45248. Elife. 2019. PMID: 31232685 Free PMC article. - Gene targeting of a disease-related gene in human induced pluripotent stem and embryonic stem cells.
Zou J, Maeder ML, Mali P, Pruett-Miller SM, Thibodeau-Beganny S, Chou BK, Chen G, Ye Z, Park IH, Daley GQ, Porteus MH, Joung JK, Cheng L. Zou J, et al. Cell Stem Cell. 2009 Jul 2;5(1):97-110. doi: 10.1016/j.stem.2009.05.023. Epub 2009 Jun 18. Cell Stem Cell. 2009. PMID: 19540188 Free PMC article. - The genotypic and phenotypic spectrum of PIGA deficiency.
Tarailo-Graovac M, Sinclair G, Stockler-Ipsiroglu S, Van Allen M, Rozmus J, Shyr C, Biancheri R, Oh T, Sayson B, Lafek M, Ross CJ, Robinson WP, Wasserman WW, Rossi A, van Karnebeek CD. Tarailo-Graovac M, et al. Orphanet J Rare Dis. 2015 Feb 27;10:23. doi: 10.1186/s13023-015-0243-8. Orphanet J Rare Dis. 2015. PMID: 25885527 Free PMC article. - Glycosyl phosphatidylinositol anchor biosynthesis is essential for maintaining epithelial integrity during Caenorhabditis elegans embryogenesis.
Budirahardja Y, Doan TD, Zaidel-Bar R. Budirahardja Y, et al. PLoS Genet. 2015 Mar 25;11(3):e1005082. doi: 10.1371/journal.pgen.1005082. eCollection 2015 Mar. PLoS Genet. 2015. PMID: 25807459 Free PMC article. - Human-induced pluripotent stem cells from blood cells of healthy donors and patients with acquired blood disorders.
Ye Z, Zhan H, Mali P, Dowey S, Williams DM, Jang YY, Dang CV, Spivak JL, Moliterno AR, Cheng L. Ye Z, et al. Blood. 2009 Dec 24;114(27):5473-80. doi: 10.1182/blood-2009-04-217406. Epub 2009 Oct 1. Blood. 2009. PMID: 19797525 Free PMC article.
References
- Adjaye J, Huntriss J, Herwig R, BenKahla A, Brink TC, Wierling C, Hultschig C, Groth D, Yaspo ML, Picton HM, et al. Primary differentiation in the human blastocyst: comparative molecular portraits of inner cell mass and trophectoderm cells. Stem Cells. 2005;23:1514–25. - PubMed
- Babitt JL, Zhang Y, Samad TA, Xia Y, Tang J, Campagna JA, Schneyer AL, Woolf CJ, Lin HY. Repulsive guidance molecule (RGMa), a DRAGON homologue, is a bone morphogenetic protein co-receptor. J Biol Chem. 2005;280:29820–7. - PubMed
- Babitt JL, Huang FW, Wrighting DM, Xia Y, Sidis Y, Samad TA, Campagna JA, Chung RT, Schneyer AL, Woolf CJ, et al. Bone morphogenetic protein signaling by hemojuvelin regulates hepcidin expression. Nat Genet. 2006;38:531–9. - PubMed
- Besser D. Expression of nodal, lefty-a, and lefty-B in undifferentiated human embryonic stem cells requires activation of Smad2/3. J Biol Chem. 2004;279:45076–84. - PubMed
- Brodsky RA, Mukhina GL, Nelson KL, Lawrence TS, Jones RJ, Buckley JT. Resistance of Paroxysmal Nocturnal Hemoglobinuria Cells to the Glycosylphosphatidylinositol-Binding Toxin Aerolysin. Blood. 1999;93:1749–56. - PubMed
Publication types
MeSH terms
Substances
Grants and funding
- P01 CA070970/CA/NCI NIH HHS/United States
- T32 HL007525/HL/NHLBI NIH HHS/United States
- CA70970/CA/NCI NIH HHS/United States
- R01 HL073781/HL/NHLBI NIH HHS/United States
- HL73781/HL/NHLBI NIH HHS/United States
- T32HL007525/HL/NHLBI NIH HHS/United States
- F32HL086168/HL/NHLBI NIH HHS/United States
- F32 HL086168/HL/NHLBI NIH HHS/United States
LinkOut - more resources
Full Text Sources
Other Literature Sources
Miscellaneous


