Perturbation of syndapin/PACSIN impairs synaptic vesicle recycling evoked by intense stimulation - PubMed (original) (raw)
Perturbation of syndapin/PACSIN impairs synaptic vesicle recycling evoked by intense stimulation
Fredrik Andersson et al. J Neurosci. 2008.
Abstract
Synaptic vesicle recycling has been proposed to depend on proteins which coordinate membrane and cytoskeletal dynamics. Here, we examine the role of the dynamin- and N-WASP (neural Wiskott-Aldrich syndrome protein)-binding protein syndapin/PACSIN at the lamprey reticulospinal synapse. We find that presynaptic microinjection of syndapin antibodies inhibits vesicle recycling evoked by intense (5 Hz or more), but not by light (0.2 Hz) stimulation. This contrasts with the inhibition at light stimulation induced by perturbation of amphiphysin (Shupliakov et al., 1997). Inhibition by syndapin antibodies was associated with massive accumulation of membranous cisternae and invaginations around release sites, but not of coated pits at the plasma membrane. Cisternae contained vesicle membrane, as shown by vesicle-associated membrane protein 2 (VAMP2)/synaptobrevin 2 immunolabeling. Similar effects were observed when syndapin was perturbed before onset of massive endocytosis induced by preceding intense stimulation. Selective perturbation of the Src homology 3 domain interactions of syndapin was sufficient to induce vesicle depletion and accumulation of cisternae. Our data show an involvement of syndapin in synaptic vesicle recycling evoked by intense stimulation. We propose that syndapin is required to stabilize the plasma membrane and/or facilitate bulk endocytosis at high release rates.
Figures
Figure 1.
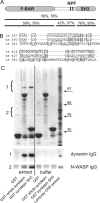
Characterization of lamprey syndapin. A, Domain structure of the lamprey syndapin ortholog with the sequence identity and similarity to human syndapin 1 indicated (F-BAR domain, amino acids 1–326; SH3 domain, amino acids 387–442). B, Alignment of SH3 domains from lamprey syndapin (ls), human syndapin (hs), and lamprey amphiphysin (la). C, Pull-down with GST fusion proteins of syndapin (full-length lamprey syndapin and isolated SH3 domain, respectively) from lamprey CNS extract. Top, Coomassie staining; bottom, immunoblot with antibodies against dynamin and N-WASP, respectively. Arrows indicate molecular weight markers (n = 3).
Figure 2.
Syndapin is accumulated at synaptic release sites. A, Immunoblot with antibodies against syndapin on lamprey CNS extract (n = 5). B, Accumulation of Alexa 488-coupled syndapin antibodies (left) and Alexa 546-coupled VAMP2 antibodies (middle) at release sites after coinjection of the two antibodies into a reticulospinal axon (n = 5 axons in 3 animals). The images show a confocal section at the respective channel with the merged image in the right panel. Scale bar, 5 μm.
Figure 3.
Low-frequency synaptic transmission is maintained after presynaptic microinjection of syndapin antibodies. A, Amplitude of a reticulospinal EPSP (dots and line) recorded during stimulation at 0.2 Hz. Alexa 649-labeled syndapin antibodies were pressure microinjected after 5 min of recording. The bars indicate the fluorescence intensity at the location of the release sites in the axon. Sample traces show averages at 1–2 and 17–18 min, respectively. Calibration: 20 ms, 0.5 mV. B, C, Electron micrographs of a synapse in a syndapin antibody-injected axon (B) and in an uninjected control axon (C) stimulated at 0.2 Hz for 30 min. Note the similar ultrastructure in the two cases with large synaptic vesicle clusters (for quantitative data, see Results). Scale bar, 0.2 μm.
Figure 4.
VAMP2-containing cisternae in syndapin antibody-injected axons stimulated at 5 Hz. Micrograph of a synapse in a 250-nm-thick section of an axon microinjected with syndapin antibodies, stimulated at 5 Hz for 30 min and then maintained at rest for 15 min. The axon was cut open (Evergren et al., 2004a) and labeled with VAMP2 antibodies from the cytoplasmic side. Note the gold particles associated with membrane cisternae and synaptic vesicles. Scale bar, 0.2 μm.
Figure 5.
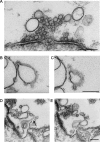
VAMP2-containing cisternae in syndapin antibody-injected axons stimulated at 5 Hz. A, Electron micrograph of an ultrathin section cut through the active zone in an axon labeled with VAMP2 antibodies after stimulation at 5 Hz for 30 min and 15 min of rest. B, C, Adjacent sections through a cisternal structure with clathrin-coated pits located near a synapse in a similarly treated axon. D, E, Adjacent ultrathin sections including the periactive zone of a synapse in a similarly treated axon. Note the continuity between the cisternae and the plasma membrane (arrow). Scale bars, 0.2 μm.
Figure 6.
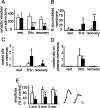
Quantitative analysis of the effects of syndapin antibody microinjection. A–D, Data from experiments with sustained 5 Hz stimulation, including values from axons maintained at rest, axons fixed directly after stimulation (5 Hz, 30 min), and axons permitted to recover for 15 min after stimulation (5 Hz, 30 min). Values for one representative experiment are shown. Similar results were obtained in at least three independent experiments (i.e., different animals). Open bars, Synapses in uninjected control axons; filled bars, synapses in adjacent axons injected with syndapin antibodies. A, Number of synaptic vesicles per center section normalized to the length of the active zone. B, Cisternal membrane structures in the synaptic region. The percentage of the synaptic area occupied by membranous structures larger than 100 nm (longest diameter) was measured. C, Number of coated pits located on cisternae. D, Coated pits on the plasma membrane proper (i. e., on regions of plasma membrane apposing the plasma membrane of another cell). Results are derived from five to six synapses in each group (mean ± SD). E, Recovery of reticulospinal EPSPs after intense stimulation. The EPSP amplitude was measured before and after 10 min of 50 Hz stimulation. The bars represent the averaged EPSP amplitude (recorded at 0.2 Hz) during the first, second, and third minute after cessation of 50 Hz stimulation, normalized to the amplitude recorded before stimulation. Open bars, Axons injected with inactive control antibodies (mean ± SD, n = 6 synaptic connections in 6 animals). Filled bars, Axons injected with syndapin antibodies (n = 6, synaptic connections in 6 animals; t test). Sample traces show averages before (left trace) and during the second min after (right trace) cessation of 50 Hz stimulation. Calibration: 5 ms, 0.5 mV. *p < 0.05; **p < 0.01; ***p < 0.001.
Figure 7.
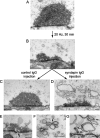
Accumulation of cisternae after a single round of endocytosis released in the presence of syndapin antibodies. A, Unstimulated control synapse. B, Synapse in an axon stimulated at 20 Hz for 30 min (at 8°) and then maintained at 1°C for 6 min until fixation. C, Synapse in an axon stimulated at 20 Hz for 30 min (at 8°), then maintained at 1°C while inactive control antibodies were microinjected. The temperature was then raised to 8° before fixation. The vesicle cluster has recovered. D, Synapse in an axon treated as in C, but with microinjection of syndapin antibodies. The vesicle cluster has failed to recover and numerous cisternae have accumulated. E–G, Details from the experiment shown in D. E, Cisterna connected to the plasma membrane (arrow). F, Thin connection between two cisternae (arrow). G, Coated pits (arrows) on cisternae. Scale bars, 0.2 μm.
Figure 8.
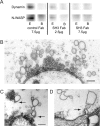
Fab fragments to the SH3 domain of syndapin cause vesicle depletion and accumulation of cisternae at stimulated synapses. A, Pull-down from lamprey CNS extract with the GST-SH3 domains of syndapin (1 mg) analyzed by Western blot using dynamin and N-WASP antibodies (E, extract; B, buffer). Addition of syndapin SH3 Fab fragments (6 mg, top) inhibited binding of dynamin and N-WASP. B, Electron micrograph of a center section of a synapse in an axon microinjected with syndapin SH3 Fab fragments followed by stimulation at 5 Hz for 30 min. Numerous cisternae occur in the synaptic region. C, Coated pits (arrows) connected with cisternae in a synapse treated as in B. D, The margin of a synapse treated as in B. Cisternae connected (arrow) with the plasma membrane occur in the periactive zone. Scale bars, 0.2 μm.
Similar articles
- Syndapin I, a synaptic dynamin-binding protein that associates with the neural Wiskott-Aldrich syndrome protein.
Qualmann B, Roos J, DiGregorio PJ, Kelly RB. Qualmann B, et al. Mol Biol Cell. 1999 Feb;10(2):501-13. doi: 10.1091/mbc.10.2.501. Mol Biol Cell. 1999. PMID: 9950691 Free PMC article. - Syndapin isoforms participate in receptor-mediated endocytosis and actin organization.
Qualmann B, Kelly RB. Qualmann B, et al. J Cell Biol. 2000 Mar 6;148(5):1047-62. doi: 10.1083/jcb.148.5.1047. J Cell Biol. 2000. PMID: 10704453 Free PMC article. - Selective perturbation of the BAR domain of endophilin impairs synaptic vesicle endocytosis.
Andersson F, Löw P, Brodin L. Andersson F, et al. Synapse. 2010 Jul;64(7):556-60. doi: 10.1002/syn.20772. Synapse. 2010. PMID: 20222153 - Syndapin--a membrane remodelling and endocytic F-BAR protein.
Quan A, Robinson PJ. Quan A, et al. FEBS J. 2013 Nov;280(21):5198-212. doi: 10.1111/febs.12343. Epub 2013 Jul 5. FEBS J. 2013. PMID: 23668323 Review. - The syndapin protein family: linking membrane trafficking with the cytoskeleton.
Kessels MM, Qualmann B. Kessels MM, et al. J Cell Sci. 2004 Jul 1;117(Pt 15):3077-86. doi: 10.1242/jcs.01290. J Cell Sci. 2004. PMID: 15226389 Review.
Cited by
- PICK1 interacts with PACSIN to regulate AMPA receptor internalization and cerebellar long-term depression.
Anggono V, Koç-Schmitz Y, Widagdo J, Kormann J, Quan A, Chen CM, Robinson PJ, Choi SY, Linden DJ, Plomann M, Huganir RL. Anggono V, et al. Proc Natl Acad Sci U S A. 2013 Aug 20;110(34):13976-81. doi: 10.1073/pnas.1312467110. Epub 2013 Aug 5. Proc Natl Acad Sci U S A. 2013. PMID: 23918399 Free PMC article. - Crystallization and preliminary X-ray crystallographic analysis of human PACSIN 1 protein.
Bai X, Meng G, Li G, Luo M, Zheng X. Bai X, et al. Acta Crystallogr Sect F Struct Biol Cryst Commun. 2010 Jan 1;66(Pt 1):73-5. doi: 10.1107/S1744309109049549. Epub 2009 Dec 25. Acta Crystallogr Sect F Struct Biol Cryst Commun. 2010. PMID: 20057076 Free PMC article. - Syndapin is dispensable for synaptic vesicle endocytosis at the Drosophila larval neuromuscular junction.
Kumar V, Alla SR, Krishnan KS, Ramaswami M. Kumar V, et al. Mol Cell Neurosci. 2009 Feb;40(2):234-41. doi: 10.1016/j.mcn.2008.10.011. Epub 2008 Nov 12. Mol Cell Neurosci. 2009. PMID: 19059483 Free PMC article. - Proteomic analysis of glycine receptor β subunit (GlyRβ)-interacting proteins: evidence for syndapin I regulating synaptic glycine receptors.
Del Pino I, Koch D, Schemm R, Qualmann B, Betz H, Paarmann I. Del Pino I, et al. J Biol Chem. 2014 Apr 18;289(16):11396-11409. doi: 10.1074/jbc.M113.504860. Epub 2014 Feb 7. J Biol Chem. 2014. PMID: 24509844 Free PMC article. - Loss of myosin Vb promotes apical bulk endocytosis in neonatal enterocytes.
Engevik AC, Kaji I, Postema MM, Faust JJ, Meyer AR, Williams JA, Fitz GN, Tyska MJ, Wilson JM, Goldenring JR. Engevik AC, et al. J Cell Biol. 2019 Nov 4;218(11):3647-3662. doi: 10.1083/jcb.201902063. Epub 2019 Sep 27. J Cell Biol. 2019. PMID: 31562230 Free PMC article.
References
- Bourne J, Morgan JR, Pieribone VA. Actin polymerization regulates clathrin coat maturation during early stages of synaptic vesicle recycling at lamprey synapses. J Comp Neurol. 2006;497:600–609. - PubMed
Publication types
MeSH terms
Substances
LinkOut - more resources
Full Text Sources
Miscellaneous
