Proinflammatory role of amphiregulin, an epidermal growth factor family member whose expression is augmented in rheumatoid arthritis patients - PubMed (original) (raw)
doi: 10.1186/1476-9255-5-5.
Satoru Ishida, Yukie Hanamoto, Ken-Ichi Kumagai, Riako Masuda, Konagi Tanaka, Noriyuki Shiobara, Noriko Yamane, Toshihito Mori, Takuo Juji, Naoshi Fukui, Tsunetoshi Itoh, Takahiro Ochi, Ryuji Suzuki
Affiliations
- PMID: 18439312
- PMCID: PMC2396620
- DOI: 10.1186/1476-9255-5-5
Proinflammatory role of amphiregulin, an epidermal growth factor family member whose expression is augmented in rheumatoid arthritis patients
Shoji Yamane et al. J Inflamm (Lond). 2008.
Abstract
Background: The epidermal growth factor (EGF) and EGF receptor (EGFR) families play important roles in the hyperplastic growth of several tissues as well as tumor growth. Since synovial hyperplasia in rheumatoid arthritis (RA) resembles a tumor, involvement of the EGF/EGFR families in RA pathology has been implied. Although several reports have suggested that ErbB2 is the most important member of the EGFR family for the synovitis in RA, it remains unclear which members of the EGF family are involved. To clarify the EGF-like growth factors involved in the pathology of RA, we investigated the expression levels of seven major EGF-like growth factors in RA patients compared with those in osteoarthritis (OA) patients and healthy control subjects.
Methods: The expression levels of seven EGF-like growth factors and four EGFR-like receptors were measured in mononuclear cells isolated from bone marrow and venous blood, as well as in synovial tissues, using quantitative RT-PCR. Further evidence of gene expression was obtained by ELISAs. The proinflammatory roles were assessed by the growth-promoting and cytokine-inducing effects of the corresponding recombinant proteins on cultured fibroblast-like synoviocytes (FLS).
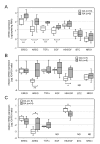
Results: Among the seven EGF-like ligands examined, only amphiregulin (AREG) was expressed at higher levels in all three RA tissues tested compared with the levels in OA tissues. The AREG protein concentration in RA synovial fluid was also higher than that in OA synovial fluid. Furthermore, recombinant human AREG stimulated FLS to proliferate and produce several proinflammatory cytokines, including angiogenic cytokines such as interleukin-8 and vascular endothelial growth factor (VEGF), in a dose-dependent manner. The VEGF mRNA levels in RA synovia and VEGF protein concentrations in RA synovial fluid were significantly higher than those in the corresponding OA samples and highly correlated with the levels of AREG.
Conclusion: The present findings suggest that AREG functions to stimulate synovial cells and that elevated levels of AREG may be involved in the pathogenesis of RA.
Figures
Figure 1
mRNA expression levels of EGF-related growth factors in BMMCs (A), PBMCs (B) and synovial tissues (C). The results of real-time PCR are shown as box-plots. The log ratio of the mRNA quantities relative to the total RNA amount (A) or GAPDH mRNA (B, C) is plotted on the y-axis of each graph. The upper and lower error bars indicate the 90th and 10th percentiles, respectively. The upper and lower edges of each box indicate the 75th and 25th percentiles, respectively, and the line inside the box shows the median. Genes not detected are shown as ND. The differences between the mRNA levels in the RA and control samples were analyzed by the Mann-Whitney U-test, and significant differences are shown by asterisks (*P < 0.05; **P < 0.01). RA: samples from RA patients; OA: samples from OA patients.
Figure 2
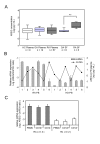
Amphiregulin expression in peripheral blood and synovial fluid samples. (A) The concentrations of AREG in plasma and synovial fluid samples are plotted as log-values on the y-axis of box-plots. Significant differences are shown by asterisks (**P < 0.01). RA: samples from RA patients; OA: samples from OA patients; HC: samples from healthy volunteers. (B) The AREG mRNA expression levels in PBMCs and AREG protein concentrations in plasma are shown. Venous blood samples from 6 RA patients and 6 healthy volunteers (HC) were separated into plasma and PBMCs. Total RNAs were extracted from PBMCs and subjected to cDNA synthesis. The AREG mRNA levels were measured by real-time PCR and normalized by the GAPDH mRNA levels. The relative AREG mRNA level relative to the GAPDH mRNA level is plotted as the log ratio on the primary y-axis (left), while the plasma concentration of AREG protein measured by ELISA is plotted as the log value on the secondary y-axis (right). The correlation coefficient (ρ) of the protein level in plasma to the mRNA level in PBMCs is -0.378 (P = 0.2104). (C) PBMCs from 4 RA patients and 2 HCs were separated by CD14 microbeads, and the AREG mRNA level in each fraction was measured by real-time PCR. The log ratio of the AREG mRNA level relative to the GAPDH mRNA level is plotted on the y-axis.
Figure 3
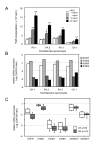
Stimulatory activity of AREG on the proliferation of RA-FLS. (A) Effect of AREG on the proliferation of RA-FLS. Three RA-FLS lines and one OA-FLS line were cultured with the indicated concentrations of AREG. After 24 h of stimulation, the cells were labeled with 3H-thymidine for 18 h and then harvested on glass filters with a cell harvester. The incorporated radioactivity was measured by liquid scintillation counting. The values are shown as the means ± SD of three independent experiments. Significant differences are shown by asterisks (*P < 0.05; **P < 0.01). (B) Expression profiles of EGFR family members in FLS. cDNA samples of the four FLS lines used in the proliferation assay were subjected to real-time PCR analysis. (C) Expression profiles of the receptors and sheddases of the EGF family in synovia. cDNAs of synovial tissues from 10 RA patients and 6 OA patients were subjected to real-time PCR analysis.
Figure 4
Stimulatory activity of AREG on cytokine production by RA-FLS. (A) Effects of AREG on cytokine expression in RA-FLS. Four RA-FLS lines were cultured with the indicated concentrations of recombinant human AREG and/or genistein. After 4 h of stimulation, total RNAs were extracted and the mRNA levels of PDGF, bFGF, VEGF, IL-1β, IL-6, IL-8, TNF-α and GM-CSF were measured by real-time PCR. The results for VEGF, IL-8, GM-CSF and IL-6 are shown. The results for the other molecules were omitted from the figure, since AREG had no effect on their expressions. (B) Effects of AREG on cytokine production by RA-FLS. Four RA-FLS lines were cultured with the indicated concentrations of AREG for 24 h. The GM-CSF, IL-6, IL-8 and VEGF concentrations in the supernatants were measured by ELISA, and are shown as means ± SD. (C) Effects of AREG on the expression of sheddases. The same cDNA samples used in panel A were subjected to real-time PCR analysis for ADAM10 and ADAM17. The results for ADAM10 were omitted from the figure, since they were similar to those for ADAM17. Each panel shows a representative result of three independent experiments. Significant differences from unstimulated cells are shown by asterisks (*P < 0.05; **P < 0.01).
Figure 5
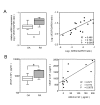
Correlation between AREG and VEGF expression levels. (A) The VEGF mRNA expression levels in synovia from 10 RA patients and 6 OA patients were measured by real-time PCR, and are shown by box-plots (left). Significant differences from unstimulated cells are shown by asterisks (*P < 0.05). The correlation between the mRNA levels of VEGF and AREG is shown by a distribution chart (right). The linear regression coefficient (R2) is 0.496 and the correlation coefficient (ρ) is 0.700 (P = 0.0067). (B) The concentrations of VEGF in synovial fluids from 7 RA patients and 6 OA patients were measured by ELISA, and are shown by box-plots (left). Significant differences from unstimulated cells are shown by asterisks (*P < 0.05). The correlation between the protein concentrations of VEGF and AREG is shown by a distribution chart (right), in which R2 is 0.577 and ρ is 0.772 (P = 0.0075).
Similar articles
- TACE-dependent amphiregulin release is induced by IL-1β and promotes cell invasion in fibroblast-like synoviocytes in rheumatoid arthritis.
Liu FL, Wu CC, Chang DM. Liu FL, et al. Rheumatology (Oxford). 2014 Feb;53(2):260-9. doi: 10.1093/rheumatology/ket350. Epub 2013 Nov 6. Rheumatology (Oxford). 2014. PMID: 24196392 - Tumor necrosis factor-alpha induces vascular endothelial growth factor-C expression in rheumatoid synoviocytes.
Cha HS, Bae EK, Koh JH, Chai JY, Jeon CH, Ahn KS, Kim J, Koh EM. Cha HS, et al. J Rheumatol. 2007 Jan;34(1):16-9. J Rheumatol. 2007. PMID: 17216674 - Wnt1 inducible signaling pathway protein-3 regulation and microsatellite structure in arthritis.
Cheon H, Boyle DL, Firestein GS. Cheon H, et al. J Rheumatol. 2004 Nov;31(11):2106-14. J Rheumatol. 2004. PMID: 15517620 - Platelet-derived growth factors and heparin-binding (fibroblast) growth factors in the synovial tissue pathology of rheumatoid arthritis.
Remmers EF, Sano H, Wilder RL. Remmers EF, et al. Semin Arthritis Rheum. 1991 Dec;21(3):191-9. doi: 10.1016/0049-0172(91)90009-o. Semin Arthritis Rheum. 1991. PMID: 1724096 Review. - Wnt signaling pathway in rheumatoid arthritis, with special emphasis on the different roles in synovial inflammation and bone remodeling.
Miao CG, Yang YY, He X, Li XF, Huang C, Huang Y, Zhang L, Lv XW, Jin Y, Li J. Miao CG, et al. Cell Signal. 2013 Oct;25(10):2069-78. doi: 10.1016/j.cellsig.2013.04.002. Epub 2013 Apr 17. Cell Signal. 2013. PMID: 23602936 Review.
Cited by
- A towards-multidimensional screening approach to predict candidate genes of rheumatoid arthritis based on SNP, structural and functional annotations.
Zhang L, Li W, Song L, Chen L. Zhang L, et al. BMC Med Genomics. 2010 Aug 20;3:38. doi: 10.1186/1755-8794-3-38. BMC Med Genomics. 2010. PMID: 20727150 Free PMC article. - Abundance of Non-Polarized Lung Macrophages with Poor Phagocytic Function in Chronic Obstructive Pulmonary Disease (COPD).
Akata K, Yamasaki K, Leitao Filho FS, Yang CX, Takiguchi H, Sahin B, Whalen BA, Yang CWT, Leung JM, Sin DD, van Eeden SF. Akata K, et al. Biomedicines. 2020 Oct 8;8(10):398. doi: 10.3390/biomedicines8100398. Biomedicines. 2020. PMID: 33050042 Free PMC article. - A ligand-receptor interactome platform for discovery of pain mechanisms and therapeutic targets.
Wangzhou A, Paige C, Neerukonda SV, Naik DK, Kume M, David ET, Dussor G, Ray PR, Price TJ. Wangzhou A, et al. Sci Signal. 2021 Mar 16;14(674):eabe1648. doi: 10.1126/scisignal.abe1648. Sci Signal. 2021. PMID: 33727337 Free PMC article. - Tolerogenic dendritic cells that inhibit autoimmune arthritis can be induced by a combination of carvacrol and thermal stress.
Spiering R, van der Zee R, Wagenaar J, Kapetis D, Zolezzi F, van Eden W, Broere F. Spiering R, et al. PLoS One. 2012;7(9):e46336. doi: 10.1371/journal.pone.0046336. Epub 2012 Sep 25. PLoS One. 2012. PMID: 23050016 Free PMC article. - De novo hem- and lymphangiogenesis by endothelial progenitor and mesenchymal stem cells in immunocompetent mice.
Buttler K, Badar M, Seiffart V, Laggies S, Gross G, Wilting J, Weich HA. Buttler K, et al. Cell Mol Life Sci. 2014 Apr;71(8):1513-27. doi: 10.1007/s00018-013-1460-8. Epub 2013 Sep 1. Cell Mol Life Sci. 2014. PMID: 23995988 Free PMC article.
References
- Hamilton JA. Hypothesis: in vitro evidence for the invasive and tumor-like properties of the rheumatoid pannus. J Rheumatol. 1983;10:845–851. - PubMed
- Schedel J, Distler O, Woenckhaus M, Gay RE, Simmen B, Michel BA, Muller-Ladner U, Gay S. Discrepancy between mRNA and protein expression of tumour suppressor maspin in synovial tissue may contribute to synovial hyperplasia in rheumatoid arthritis. Ann Rheum Dis. 2004;63:1205–1211. doi: 10.1136/ard.2003.006312. - DOI - PMC - PubMed
LinkOut - more resources
Full Text Sources
Other Literature Sources
Research Materials
Miscellaneous


