Different mutant/wild-type p53 combinations cause a spectrum of increased invasive potential in nonmalignant immortalized human mammary epithelial cells - PubMed (original) (raw)
Different mutant/wild-type p53 combinations cause a spectrum of increased invasive potential in nonmalignant immortalized human mammary epithelial cells
Damian J Junk et al. Neoplasia. 2008 May.
Abstract
Aberrations of p53 occur in most, if not all, human cancers. In breast cancer, p53 mutation is the most common genetic defect related to a single gene. Immortalized human mammary epithelial cells resemble the earliest forms of aberrant breast tissue growth but do not express many malignancy-associated phenotypes. We created a model of human mammary epithelial tumorigenesis by infecting hTERT-HME1 immortalized human mammary epithelial cells expressing wild-type p53 with four different mutant p53 constructs to determine the role of p53 mutation on the evolution of tumor phenotypes. We demonstrate that different mutant/wild-type p53 heterozygous models generate loss of function, dominant negative activity, and a spectrum of gain of function activities that induce varying degrees of invasive potential. We suggest that this model can be used to elucidate changes that occur in early stages of human mammary epithelial tumorigenesis. These changes may constitute novel biomarkers or reveal novel treatment modalities that could inhibit progression from primary to metastatic breast disease.
Figures
Figure 1
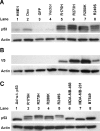
Endogenous wild-type p53 accumulates in response to mutant p53 accumulation. Western blots were conducted with either anti-V5 or anti-p53 clone DO-1 and anti-actin as a loading control. (A) One representative Western blot from three independent experiments shows p53 levels in parental (HME1), doxorubicintreated (DOX), GFP only control (GFP), vector only control (Vector), and mutant _p53_-expressing HME1 cell lines (R175H, R273H, R280K, and R249S). The double band for p53 in lanes 5 to 8 represents the exogenous V5-tagged mutant p53 as the larger protein and the endogenous wild-type p53 as the smaller protein. (B) One representative Western blot from three independent experiments demonstrates the relative accumulation of the V5-tagged exogenous mutant p53 in each of the mutant _p53_-expressing HME1 cell lines; labels are the same as panel A. (C) One representative Western blot from three independent experiments of adenoviral wild-type p53 (Ad w.t. p53), mutant _p53_-expressing HME1 stable cell lines (R175H, R273H, R280K, and R249S), MDA-MB-468, MDAMB-231, and BT549 breast cancer cell lines. The double band for p53 in lanes 2 to 5 represents the exogenous V5-tagged mutant p53 and the endogenous wild-type p53.
Figure 2
Endogenous wild-type p53 interacts with accumulated exogenous mutant p53. Immunoprecipitations were conducted with a non-specific antibody, or an anti-V5 antibody that recognizes the exogenous mutant p53 protein. Western blots of the immunoprecipitates were conducted with an anti-p53 clone DO-1 antibody that recognizes both mutant and wild-type p53. (A) One representative Western blot from three independently immunoprecipitated samples. Lane 1 is 30 µg of whole cell lysate (WCL) from HME1 as a positive control for p53. Even lanes 2 to 14 are immunoprecipitates of the nonspecific antibody control. Odd lanes 3 to 15 are V5 antibody-specific immunoprecipitates. (B) Levels of wild-type p53 relative to the mutants in each HME1 mutant _p53_-expressing cell line. The quantification and standard error of the mean were calculated from Western blots of three independent experiments and show the amounts of wild-type p53 (w.t.) relative to the mutant p53 (mut) in each of the HME1 mutant _p53_-expressing cell lines (R175H, R273H, R280K, and R249S).
Figure 3
Mutant p53 does not inhibit nuclear localization of wild-type p53 in HME1 cells. Parental (HME1), vector only control (Vector), and mutant p53 (R175H, R273H, R280K, and R249S) stably expressing HME1 cells were assayed by immunofluorescence for subcellular localization of p53. Cells were stained for p53 with Cy3 (top row, red). Nuclei were counterstained with 4′,6-diamidino-2-phenylindole (middle row, blue). Images were merged to show nuclear localization of p53 in all cell lines (bottom row, pink).
Figure 4
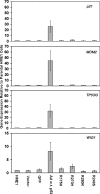
Real-time RT-PCR confirms dominant negative activity of mutant p53. The bar graphs represent average fold change in expression and standard error of the mean relative to parental HME1 cells for the vector only control, GFP control, wild-type adenoviral p53 (Ad w.t. p53), and the mutant _p53_-expressing HME1 cell lines (R175H, R273H, R280K, and R249S).
Figure 5
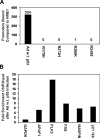
Mutant p53 inhibits DNA binding of endogenous wildtype p53. (A) Chromatin immunoprecipitation of p53 coupled to a human gene promoter microarray was used to determine p53 binding throughout the genome. Data were analyzed from three independent experiments plus dye swap. The bar graph represents the number of elements bound by p53 in adenoviral wild-type _p53_-infected HME1 cells (Ad w.t. p53) and the mutant _p53_-expressing HME1 cells (R175H, R273H, R280K, and R249S) compared to the parental HME1 cells. Differentially bound promoters were determined as explained in materials and methods. (B) Real-time PCR confirms binding of adenoviral wild-type p53 to its target genes. The bar graph represents the fold enrichment over input of the six genes in response to adenoviral wild-type p53 infection. GAPDH is a control that is not bound by p53, as evidenced by no enrichment of ChIP versus input. The other genes confirm the ability of wild-type p53 to bind the promoter regions of these genes in hTERT-HME1 cells after wildtype p53 adenoviral infection.
Figure 6
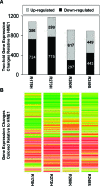
Mutant p53 alters patterns of gene expression in HME1 cells. Microarray expression analysis was conducted to determine gene expression changes in response to mutant p53 accumulation in HME1 cells. (A) The bar graph represents the number of genes whose expression changed at least two-fold in response to mutant _p53_-expressing HME1 cell lines (R175H, R273H, R280K, and R249S). The top of each bar represents elements that were increased in expression. The bottom of each bar represents elements that were decreased in expression. The actual numbers of increased and decreased elements are embedded in the corresponding area of the graphs. (B) The heat map represents the trends in gene expression in response to mutant p53. It shows the expression levels in each mutant p53 cell line of every gene that was found differentially expressed in at least one treatment from panel A. Red and green indicate increases and decreases in expression, respectively.
Figure 7
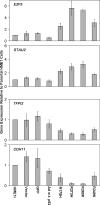
Real-time RT-PCR confirms novel expression changes induced by mutant p53. The bar graphs represent average fold change in expression and standard error of the mean relative to parental HME1 cells for the vector only control, GFP control, wild-type adenoviral p53 (Ad w.t. p53), and the mutant _p53_-expressing HME1 (R175H, R273H, R280K, and R249S) cell lines.
Figure 8
Mutant p53 has no effect on a variety of phenotypes associated with tumor cells. (A) One representative depiction of cell cycle distribution demonstrates that the accumulation of different mutant p53 proteins has no effect on the cell cycle. Addition of wild-type p53 induces a G1 arrest. (B) One representative depiction of cell cycle distribution following serum deprivation demonstrates G1 arrest in all samples. Labels are the same from panel A. (C) The bar graph represents the average cell number and standard error of the mean for each cell line at the indicated days. The _y_-axis is cell number x 100,000. (D) The bar graph represents the average number of colonies and the standard error of the mean for each cell line at the indicated cell dilutions. (E) The bar graph represents the average and standard error of the mean of colonies grown in semisolid media for each cell line. MDA-MB-231 cells were used as a positive control.
Figure 9
Mutant p53 accumulation causes an increase in migration and invasiveness of hTERT-HME1 cells. Migration assays using uncoated inserts and invasion assays using matrigel-coated inserts were performed on the parental HME1 cell line (HME1), vector only control HME1 cell line (Vector), adenoviral GFP control (GFP), adenoviral infected wild-type p53 (Ad w.t. p53), and mutant _p53_-expressing HME1 cell lines (R175H, R273H, R280K, and R249S). (A) Representative pictures of cells that migrated through the pores of the uncoated inserts visualized by staining with crystal violet. (B) The bar graph represents the average fold difference of migration relative to the parental HME1 cells through uncoated inserts. (C) The bar graph represents the average fold difference of invasion relative to the parental HME1 cells through matrigel-coated inserts. The cell lines were assayed in quadruplicate transwells for each experiment, and the averages were graphed with the standard error of the mean. The asterisks indicate that R273H, R280K, and R249S showed a statistically significant increase from the parental cell lines, P value < .05.
Similar articles
- p53 regulates FAK expression in human tumor cells.
Golubovskaya VM, Finch R, Kweh F, Massoll NA, Campbell-Thompson M, Wallace MR, Cance WG. Golubovskaya VM, et al. Mol Carcinog. 2008 May;47(5):373-82. doi: 10.1002/mc.20395. Mol Carcinog. 2008. PMID: 17999388 Free PMC article. - p53-dependent down-regulation of telomerase is mediated by p21waf1.
Shats I, Milyavsky M, Tang X, Stambolsky P, Erez N, Brosh R, Kogan I, Braunstein I, Tzukerman M, Ginsberg D, Rotter V. Shats I, et al. J Biol Chem. 2004 Dec 3;279(49):50976-85. doi: 10.1074/jbc.M402502200. Epub 2004 Sep 15. J Biol Chem. 2004. PMID: 15371422 - Cooperation of tumor-derived HBx mutants and p53-249(ser) mutant in regulating cell proliferation, anchorage-independent growth and aneuploidy in a telomerase-immortalized normal human hepatocyte-derived cell line.
Jiang W, Wang XW, Unger T, Forgues M, Kim JW, Hussain SP, Bowman E, Spillare EA, Lipsky MM, Meck JM, Cavalli LR, Haddad BR, Harris CC. Jiang W, et al. Int J Cancer. 2010 Sep 1;127(5):1011-20. doi: 10.1002/ijc.25118. Int J Cancer. 2010. PMID: 20017137 Free PMC article. - Culture models of human mammary epithelial cell transformation.
Stampfer MR, Yaswen P. Stampfer MR, et al. J Mammary Gland Biol Neoplasia. 2000 Oct;5(4):365-78. doi: 10.1023/a:1009525827514. J Mammary Gland Biol Neoplasia. 2000. PMID: 14973382 Review.
Cited by
- dTMP imbalance through thymidylate 5'-phosphohydrolase activity induces apoptosis in triple-negative breast cancers.
Kim DH, Kim JS, Mok CS, Chang EH, Choi J, Lim J, Kim CH, Park AR, Bae YJ, Koo BS, Lee HC. Kim DH, et al. Sci Rep. 2022 Nov 21;12(1):20027. doi: 10.1038/s41598-022-24706-4. Sci Rep. 2022. PMID: 36414668 Free PMC article. - CAPE Analogs Induce Growth Arrest and Apoptosis in Breast Cancer Cells.
Beauregard AP, Harquail J, Lassalle-Claux G, Belbraouet M, Jean-Francois J, Touaibia M, Robichaud GA. Beauregard AP, et al. Molecules. 2015 Jul 10;20(7):12576-89. doi: 10.3390/molecules200712576. Molecules. 2015. PMID: 26184141 Free PMC article. - Mutant p53R175H promotes cancer initiation in the pancreas by stabilizing HSP70.
Polireddy K, Singh K, Pruski M, Jones NC, Manisundaram NV, Ponnela P, Ouellette M, Van Buren G, Younes M, Bynon JS, Dar WA, Bailey JM. Polireddy K, et al. Cancer Lett. 2019 Jul 1;453:122-130. doi: 10.1016/j.canlet.2019.03.047. Epub 2019 Apr 1. Cancer Lett. 2019. PMID: 30946870 Free PMC article. - p53 induces distinct epigenetic states at its direct target promoters.
Vrba L, Junk DJ, Novak P, Futscher BW. Vrba L, et al. BMC Genomics. 2008 Oct 15;9:486. doi: 10.1186/1471-2164-9-486. BMC Genomics. 2008. PMID: 18922183 Free PMC article. - Macrophage infiltration and genetic landscape of undifferentiated uterine sarcomas.
Przybyl J, Kowalewska M, Quattrone A, Dewaele B, Vanspauwen V, Varma S, Vennam S, Newman AM, Swierniak M, Bakuła-Zalewska E, Siedlecki JA, Bidzinski M, Cools J, van de Rijn M, Debiec-Rychter M. Przybyl J, et al. JCI Insight. 2017 Jun 2;2(11):e94033. doi: 10.1172/jci.insight.94033. eCollection 2017 Jun 2. JCI Insight. 2017. PMID: 28570276 Free PMC article.
References
- Vogelstein B, Lane D, Levine AJ. Surfing the p53 network. Nature. 2000;408:307–310. - PubMed
- Chen LC, Neubauer A, Kurisu W, Waldman FM, Ljung BM, Goodson W, III, Goldman ES, Moore D, II, Balazs M, Liu E, et al. Loss of heterozygosity on the short arm of chromosome 17 is associated with high proliferative capacity and DNA aneuploidy in primary human breast cancer. Proc Natl Acad Sci USA. 1991;88:3847–3851. - PMC - PubMed
- Chen YH, Li CD, Yap EP, McGee JO. Detection of loss of heterozygosity of p53 gene in paraffin-embedded breast cancers by non-isotopic PCR-SSCP. J Pathol. 1995;177:129–134. - PubMed
- Deng G, Chen LC, Schott DR, Thor A, Bhargava V, Ljung BM, Chew K, Smith HS. Loss of heterozygosity and p53 gene mutations in breast cancer. Cancer Res. 1994;54:499–505. - PubMed
- Singh S, Simon M, Meybohm I, Jantke I, Jonat W, Maass H, Goedde HW. Human breast cancer: frequent p53 allele loss and protein overexpression. Hum Genet. 1993;90:635–640. - PubMed
Publication types
MeSH terms
Substances
Grants and funding
- CA09213/CA/NCI NIH HHS/United States
- CA23074/CA/NCI NIH HHS/United States
- T32 CA009213/CA/NCI NIH HHS/United States
- R01 CA065662/CA/NCI NIH HHS/United States
- R29 CA065662/CA/NCI NIH HHS/United States
- P30 CA023074/CA/NCI NIH HHS/United States
- CA65662/CA/NCI NIH HHS/United States
- ES06694/ES/NIEHS NIH HHS/United States
- P30 ES006694/ES/NIEHS NIH HHS/United States
LinkOut - more resources
Full Text Sources
Other Literature Sources
Medical
Research Materials
Miscellaneous
