Rapid cycling and precocious termination of G1 phase in cells expressing CDK1AF - PubMed (original) (raw)
Rapid cycling and precocious termination of G1 phase in cells expressing CDK1AF
Joseph R Pomerening et al. Mol Biol Cell. 2008 Aug.
Abstract
In Xenopus embryos, the cell cycle is driven by an autonomous biochemical oscillator that controls the periodic activation and inactivation of cyclin B1-CDK1. The oscillator circuit includes a system of three interlinked positive and double-negative feedback loops (CDK1 -> Cdc25 -> CDK1; CDK1 -/ Wee1 -/ CDK1; and CDK1 -/ Myt1 -/ CDK1) that collectively function as a bistable trigger. Previous work established that this bistable trigger is essential for CDK1 oscillations in the early embryonic cell cycle. Here, we assess the importance of the trigger in the somatic cell cycle, where checkpoints and additional regulatory mechanisms could render it dispensable. Our approach was to express the phosphorylation site mutant CDK1AF, which short-circuits the feedback loops, in HeLa cells, and to monitor cell cycle progression by live cell fluorescence microscopy. We found that CDK1AF-expressing cells carry out a relatively normal first mitosis, but then undergo rapid cycles of cyclin B1 accumulation and destruction at intervals of 3-6 h. During these cycles, the cells enter and exit M phase-like states without carrying out cytokinesis or karyokinesis. Phenotypically similar rapid cycles were seen in Wee1 knockdown cells. These findings show that the interplay between CDK1, Wee1/Myt1, and Cdc25 is required for the establishment of G1 phase, for the normal approximately 20-h cell cycle period, and for the switch-like oscillations in cyclin B1 abundance characteristic of the somatic cell cycle. We propose that the HeLa cell cycle is built upon an unreliable negative feedback oscillator and that the normal high reliability, slow pace and switch-like character of the cycle is imposed by a bistable CDK1/Wee1/Myt1/Cdc25 system.
Figures
Figure 1.
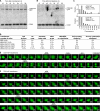
Rapid cycles in unsynchronized HeLa cells expressing CDK1AF-GFP. Unsynchronized HeLa cells were transfected with various CDK1-GFP expression constructs and an RFP-tDimer2-labeled MBS. CDK1 expression was assessed 12–30 h after transfection by immunoblotting (A and B) and mitotic progression was assessed by time-lapse fluorescence microscopy from 24 to 38 h after transfection (C–E). (A and B) Expression of transfected CDK1WT-GFP and CDK1AF-GFP. CDK1 immunoblots of p13 Suc1 precipitates from lysates of CDK1WT-GFP–transfected (A) and CDK1AF-GFP–transfected (B) HeLa cells. The lower band is the endogenous CDK1 protein. The higher band is the transfected CDK1 chimera. (C) Distribution of CDK1WT-GFP and CDK1AF-GFP expression levels. The same arbitrary fluorescence units were used for both CDK1-GFP proteins. Data are from 50 CDK1WT-GFP– and 50 CDK1AF-GFP–expressing cells. (D) Table of phenotypes observed in cells transfected with different GFP-fused versions of CDK1, or GFP alone, and the MBS. Asterisks indicate treatments where some cells exhibited multiple phenotypes; in these cases the totals across categories add up to >100%. (E) Montage of cells transfected with CDK1WT-CFP and the MBS, showing normal mitotic progression. The images show the MBS channel only. Time stamps are in minutes, with NEB taken to be t = 0. The criterion for metaphase was a maximally compact line of chromosomes at the midline. The criterion for anaphase was a visible separation of the chromosomes into two masses. (F) Montage of a cell transfected with CDK1AF-CFP and the MBS, showing rapid cycling. The images show the MBS channel only. Time stamps are in minutes, with NEB taken to be t = 0.
Figure 2.
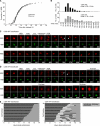
Rapid cycles of lamin A dispersal and reorganization in unsynchronized HeLa cells expressing CDK1AF-CFP. (A and B) Mitotic entry and exit as assessed by MBS (red) or lamin (green) redistribution in cells cotransfected with CDK1WT-CFP (A) or CDK1AF-CFP (B). Time stamps are in minutes, with t = 0 taken to be the first frame of the montage. (C) Mitotic phenotypes in cells transfected with no CDK1 (95 cells), CDK1WT-CFP (210 cells), or CDK1AF-CFP (328 cells). (D) Number of cycles of NEB and NER without karyokinesis or cytokinesis in the CDK1AF-CFP–transfected cells that exhibited at least one abortive mitosis. Cells were followed for 14 h beginning 24 h after transfection.
Figure 3.
Smooth, nearly-sinusoidal cyclin B1 “flashes” in unsynchronized CDK1AF-CFP–expressing cells. Unsynchronized HeLa cells were transfected with CDK1WT-CFP or CDK1AF-CFP-CFP plus cyclin B1-YFP. Cycles of cyclin accumulation and destruction were assessed by time-lapse microscopy from 24 to 38 h after transfection. (A) Montages of one CDK1WT-CFP–transfected cell and two CDK1AF-CFP–transfected cells, showing cyclin B1-YFP fluorescence. (B) Tracings of cyclin B1-YFP fluorescence as a function of time for four CDK1WT-CFP–transfected cells and eight CDK1AF-CFP–transfected cells. The same arbitrary fluorescence units are used for each plot. (C) Mitotic phenotypes in cells transfected with no CDK1 (132 cells), CDK1WT-CFP (176 cells), or CDK1AF-CFP (334 cells). (D) Numbers of cyclin flashes in the course of the 14 h video for cells coexpressing cyclin B1-YFP and CDK1WT-CFP or CDK1AF-CFP.
Figure 4.
CDK1AF-CFP-expressing cells released from a double-thymidine block carry out one normal mitosis and then cycle rapidly. HeLa cells were treated with thymidine, released from this block, and then transfected with MBS and GFP-histone H2B. After a second thymidine block, cells were released and then transfected with either CDK1WT-CFP or CDK1AF-CFP. Beginning 8 h after release, cells were imaged for 16 h. (A) Plot of cumulative percentage of NEB in cells released from a double thymidine block. A total of 142 CDK1WT-CFP– and 142 CDK1AF-CFP–transfected cells were analyzed. (B) Histograms of mitotic duration (the interval between NEB and NER) in cells transfected with CDK1WT-CFP or CDK1AF-CFP. (C and D) Montages of cells expressing either CDK1WT-CFP (C) or CDK1AF-CFP (D) after release from a double thymidine block. White arrowheads indicate which of the two daughter cells is being tracked. Montages of the individual cells do not start at the same time after transfection; cytokinesis is taken to be t = 0 for both montages. (E) Cell cycle phases in 25 CDK1WT-CFP–transfected cells (left) and 25 CDK1AF-CFP–transfected cells (right) after cytokinesis. After cytokinesis, CDK1WT-CFP–transfected cells remained in interphase for the duration of the imaging while CDK1AF-CFP–transfected cells entered a precocious M phase.
Figure 5.
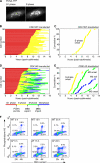
CDK1AF-CFP–expressing cells enter M phase from either early S phase or G1 phase. (A) The S phase biosensor. This PCNA-YFP chimera exhibits smooth nuclear fluorescence during G1 phase (left), and then it becomes punctate as cells enter S phase (right). (B–E) Cell cycle progression in unsynchronized HeLa cells transfected with PCNA-YFP and MBS plus either CDK1WT-CFP or CDK1AF-CFP. The time of completion of the first (normal) cytokinesis is taken to be t = 0. B and D show the time courses for 50 cells expressing CDK1WT-CFP and 50 expressing CDK1AF-CFP, respectively. C and E show the cumulative percentage of cells that had entered S phase, entered a second mitosis (M2), exited that second mitosis, and entered a third mitosis (M3) as a function of time after the completion of the first cytokinesis. (F) Flow cytometry analysis of DNA content (as assessed by propidium iodide staining) and phospho-histone H3 staining in CDK1WT-CFP– and CDK1AF-CFP–expressing HeLa cells at various times after transfection.
Figure 6.
Rapid cycles in cells treated with Wee1 d-siRNAs. HeLa cells were blocked in thymidine, released, and then transfected with cyclin B1-YFP and MBS. After a second thymidine block, cells were released and then transfected with either Wee1 d-siRNAs or control GL3 luciferase d-siRNAs. (A) Wee1 levels in cells transfected with GL3 or Wee1 d-siRNAs. (B) Numbers of cyclin flashes in Wee1 knockdown cells. Data are from the 200 daughters of 100 cell divisions. The total time of the video microscopy was 14 h. (C) Cyclin B1-YFP fluorescence in a Wee1 knockdown cell undergoing a relatively normal first mitosis, and in its two daughter cells, which undergo rapid cyclin flashes. (D) Montage of the same cells whose cyclin B1-YFP levels are quantified in B. Time stamps represent the time in minutes after release from double thymidine block. (E) Montage of an asynchronous cell transfected with Wee1 d-siRNAs, showing rapid cyclin flashes.
Figure 7.
The spindle assembly checkpoint in CDK1AF-CFP–expressing cells. Asynchronous HeLa cells were blocked in thymidine, released, and then transfected with cyclin B1-YFP and MBS. After a second thymidine block, cells were released and then transfected with either CDK1WT-CFP or CDK1AF-CFP. Ten hours after release, nocodazole was added, and cells were imaged for 16 h. (A) Montage of a CDK1AF-CFP–transfected cell that had not yet undergone mitosis at the time of nocodazole treatment. (B) Montage of two CDK1AF-CFP–transfected cells that had undergone mitosis before the time of nocodazole treatment. (C) Table of percentage of M phase arrested and percentage of cyclin B1-YFP flashers after nocodazole treatment.
Figure 8.
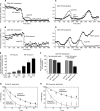
APC-Cdc20 and APC-Cdh1 activities in individual cells expressing recombinant CDK1WT-CFP and CDK1AF-CFP. Asynchronous HeLa cells were transfected with cyclin B1-YFP, WT-, or R61A-securin-tDimer2, and either CDK1WT-CFP or CDK1AF-CFP, and then they were imaged for 13 h. (A) Cyclin B1 and WT-securin destruction in a typical CDK1WT-CFP–transfected cell. (B) Cyclin B1 and R61A-securin destruction in a typical CDK1WT-CFP–transfected cell. (C) Oscillations of cyclin B1-YFP and WT-securin-tDimer2 in a CDK1AF-CFP–expressing cell. (D) Oscillations of cyclin B1-YFP and R61A-securin-tDimer2 in a CDK1AF-CFP–expressing cell. (E) Time lag between the degradation of cyclin B1-YFP and WT-securin (gray) or R61A-securin (black) in cells expressing CDK1WT-CFP or CDK1AF-CFP. Data are shown as means ± SEM. (F) Percentage of completion of cyclin B1-YFP (light gray), WT-securin-tDimer2 (dark gray), and R61A-securin-tDimer2 (black) proteolysis in successive cycles. Data are presented as means ± SEM. (G and H) Time course of cyclin B1-YFP destruction (G) and R61A-securin-tDimer2 destruction (H) in CDK1WT-CFP– and CDK1AF-CFP–expressing cells. Data are from six rounds of cyclin B1-YFP and R61A-securin-tDimer2 proteolysis in CDK1WT-CFP–transfected cells and nine rounds in CDK1AF-CFP–transfected cells.
Figure 9.
Schematic view of cyclin-CDK1 regulation. (A) Normal HeLa cells. (B) HeLa cells expressing CDK1AF or after Wee1 knockdown.
Similar articles
- Expression of constitutively active CDK1 stabilizes APC-Cdh1 substrates and potentiates premature spindle assembly and checkpoint function in G1 cells.
Ma Y, Yuan X, Wyatt WR, Pomerening JR. Ma Y, et al. PLoS One. 2012;7(3):e33835. doi: 10.1371/journal.pone.0033835. Epub 2012 Mar 29. PLoS One. 2012. PMID: 22479455 Free PMC article. - Mitotic progression becomes irreversible in prometaphase and collapses when Wee1 and Cdc25 are inhibited.
Potapova TA, Sivakumar S, Flynn JN, Li R, Gorbsky GJ. Potapova TA, et al. Mol Biol Cell. 2011 Apr 15;22(8):1191-206. doi: 10.1091/mbc.E10-07-0599. Epub 2011 Feb 16. Mol Biol Cell. 2011. PMID: 21325631 Free PMC article. - Quantitative reconstitution of mitotic CDK1 activation in somatic cell extracts.
Deibler RW, Kirschner MW. Deibler RW, et al. Mol Cell. 2010 Mar 26;37(6):753-67. doi: 10.1016/j.molcel.2010.02.023. Mol Cell. 2010. PMID: 20347419 Free PMC article. - Switches and latches: a biochemical tug-of-war between the kinases and phosphatases that control mitosis.
Domingo-Sananes MR, Kapuy O, Hunt T, Novak B. Domingo-Sananes MR, et al. Philos Trans R Soc Lond B Biol Sci. 2011 Dec 27;366(1584):3584-94. doi: 10.1098/rstb.2011.0087. Philos Trans R Soc Lond B Biol Sci. 2011. PMID: 22084385 Free PMC article. Review. - The decision to enter mitosis: feedback and redundancy in the mitotic entry network.
Lindqvist A, Rodríguez-Bravo V, Medema RH. Lindqvist A, et al. J Cell Biol. 2009 Apr 20;185(2):193-202. doi: 10.1083/jcb.200812045. Epub 2009 Apr 13. J Cell Biol. 2009. PMID: 19364923 Free PMC article. Review.
Cited by
- Uncovering the role of APC-Cdh1 in generating the dynamics of S-phase onset.
Yuan X, Srividhya J, De Luca T, Lee JH, Pomerening JR. Yuan X, et al. Mol Biol Cell. 2014 Feb;25(4):441-56. doi: 10.1091/mbc.E13-08-0480. Epub 2013 Dec 19. Mol Biol Cell. 2014. PMID: 24356446 Free PMC article. - Cyclin/Forkhead-mediated coordination of cyclin waves: an autonomous oscillator rationalizing the quantitative model of Cdk control for budding yeast.
Barberis M. Barberis M. NPJ Syst Biol Appl. 2021 Dec 13;7(1):48. doi: 10.1038/s41540-021-00201-w. NPJ Syst Biol Appl. 2021. PMID: 34903735 Free PMC article. Review. - Coupling of T161 and T14 phosphorylations protects cyclin B-CDK1 from premature activation.
Coulonval K, Kooken H, Roger PP. Coulonval K, et al. Mol Biol Cell. 2011 Nov;22(21):3971-85. doi: 10.1091/mbc.E11-02-0136. Epub 2011 Sep 7. Mol Biol Cell. 2011. PMID: 21900495 Free PMC article. - Ultrasensitivity in the Regulation of Cdc25C by Cdk1.
Trunnell NB, Poon AC, Kim SY, Ferrell JE Jr. Trunnell NB, et al. Mol Cell. 2011 Feb 4;41(3):263-74. doi: 10.1016/j.molcel.2011.01.012. Mol Cell. 2011. PMID: 21292159 Free PMC article. - Engineering light-inducible nuclear localization signals for precise spatiotemporal control of protein dynamics in living cells.
Niopek D, Benzinger D, Roensch J, Draebing T, Wehler P, Eils R, Di Ventura B. Niopek D, et al. Nat Commun. 2014 Jul 14;5:4404. doi: 10.1038/ncomms5404. Nat Commun. 2014. PMID: 25019686 Free PMC article.
References
- Beal C. M., Dixon K. E. Effect of UV on cleavage of Xenopus laevis. J. Exp. Zool. 1975;192:277–283. - PubMed
- Berridge M. J. The versatility and complexity of calcium signalling. Novartis Found. Symp. 2001;239:52–64. discussion 64–57, 150–159. - PubMed
- Chan G. K., Liu S. T., Yen T. J. Kinetochore structure and function. Trends Cell Biol. 2005;15:589–598. - PubMed
Publication types
MeSH terms
Substances
Grants and funding
- R01 GM061276-08/GM/NIGMS NIH HHS/United States
- R01 GM061276/GM/NIGMS NIH HHS/United States
- T32 CA009151/CA/NCI NIH HHS/United States
- R01 GM077544-01/GM/NIGMS NIH HHS/United States
- R01 GM077544-02/GM/NIGMS NIH HHS/United States
- R01 GM-61276/GM/NIGMS NIH HHS/United States
- R01 GM077544-03/GM/NIGMS NIH HHS/United States
- R01 GM061276-07/GM/NIGMS NIH HHS/United States
- R01 GM077544/GM/NIGMS NIH HHS/United States
- R01 GM-77544/GM/NIGMS NIH HHS/United States
LinkOut - more resources
Full Text Sources
Molecular Biology Databases
Research Materials
Miscellaneous


