Oncogenic KRAS induces progenitor cell expansion and malignant transformation in zebrafish exocrine pancreas - PubMed (original) (raw)
Oncogenic KRAS induces progenitor cell expansion and malignant transformation in zebrafish exocrine pancreas
Seung Woo Park et al. Gastroenterology. 2008 Jun.
Abstract
Background & aims: Although the cell of origin for pancreatic cancer remains unknown, prior studies have suggested that pancreatic neoplasia may be initiated in progenitor-like cells. To examine the effects of oncogene activation within the pancreatic progenitor pool, we devised a system for real-time visualization of both normal and oncogenic KRAS-expressing pancreatic progenitor cells in living zebrafish embryos.
Methods: By using BAC transgenes under the regulation of ptf1a regulatory elements, we expressed either extended green fluorescent protein (eGFP) alone or eGFP fused to oncogenic KRAS in developing zebrafish pancreas.
Results: After their initial specification, normal eGFP-labeled pancreatic progenitor cells were observed to actively migrate away from the forming endodermal gut tube, and subsequently underwent characteristic exocrine differentiation. In contrast, pancreatic progenitor cells expressing oncogenic KRAS underwent normal specification and migration, but failed to differentiate. This block in differentiation resulted in the abnormal persistence of an undifferentiated progenitor pool, and was associated with the subsequent formation of invasive pancreatic cancer. These tumors showed several features in common with the human disease, including evidence of abnormal Hedgehog pathway activation.
Conclusions: These results provide a unique view of the tumor-initiating effects of oncogenic KRAS in a living vertebrate organism, and suggest that zebrafish models of pancreatic cancer may prove useful in advancing our understanding of the human disease.
Figures
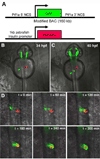
Fig. 1. Visualization of pancreatic morphogenesis in living zebrafish embryos
A, Schematic depiction of utilized transgenes. B, Merged bright and dark field images of living Tg(ptf1a:eGFP);(insulin:mCherry) double transgenic embryo at 34 hpf, demonstrating early ptf1a-expressing pancreatic progenitor cells in left lateral endoderm (green arrow), and principle islet located just to the right of the embryonic midline (red arrow). C, same embryo at 40 hpf, demonstrating migration of ptf1a-expressing progenitor cells across the midline, where they become affiliated with principle islet. D, time lapse imaging of pancreatic progenitor migration.
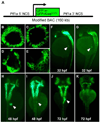
Fig. 2. Comparison of ptf1a:eGFP and ptf1a:GFP-KRASG12V transgene expression in living zebrafish embryos
A, Schematic depiction of utilized transgenes, in which ptf1a coding sequence was replaced with either eGFP or eGFP-KRASG12V coding sequence. B–E, Confocal images of retina (B and C) and pancreas (D and E) at 48 hpf. Note nuclear and cytoplasmic localization of eGFP in Tg(ptf1a:eGFP) embryos (B and D), compared to membrane localization of eGFP-KRASG12V fusion protein (C and E), reflecting activity of KRAS C-terminal CAAX motif. F–K, Whole mount dark field images of transgenic embryos, showing spatiotemporal expression pattern of eGFP vs. eGFP-KRASG12V. F, H, and J. ptf1a:eGFP embryos. G, I, and K, ptf1a:eGFP-KRASG12V embryos. eGFP-KRASG12V-expressing cells undergo normal specification and initial migration, but eGFP-KRASG12V is subsequently downregulated beginning at 48 hpf. White arrowheads indicate pancreatic domains of eGFP/ eGFP-KRASG12V expression.
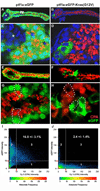
Fig. 3. Pancreatic progenitor cells with persistent eGFP-KRASG12V expression fail to undergo normal differentiation
A–H, Merged confocal images of microdissected pancreas from Tg(ptf1a:eGFP) and Tg(ptf1a:eGFP-KRASG12V) larvae at 96 hpf. Green indicates eGFP or eGFP-KRASG12V transgene expression, red Cy3 indicates immunofluorescent detection of carboxypeptidase A (CPA), a marker of exocrine differentiation. Specimens in A–D were additionally labeled with Hoechst dye. A and C, E and G represent low and high magnification images of Tg(ptf1a:eGFP) pancreas. B and D, F and H represent low and high magnification images of Tg(ptf1a:eGFP-KRASG12V) pancreas. In ptf1a:eGFP transgenic pancreas, virtually all eGFP-expressing have undergone exocrine differentiation, indicated by accumulation of CPA protein in apical zymogen granules. In _ptf1a:eGFP-KRASG12V_- transgenic pancreas, the majority of cells do not express the transgene, and are also positive for CPA, indicating normal differentiation. In contrast, small clusters of cells with persistent eGFP-KRASG12V expression are negative for CPA, indicating failure to undergo normal differentiation. Asterisks in A and C indicate ptf1a:eGFP-negative principle islet. White arrowheads in A indicate eGFP-negative pancreatic duct. For clarity, white dots outline individual cells in G, H. I and J, Pixel-by-pixel determination of eGFP (y-axis) and CPA (x-axis) fluorescent intensity, allowing quantification of eGFP/GFP-KRAS-G12V and CPA co-expression as a marker of exocrine differentiation among transgene expressing cells. Area 2 comprises eGFP-positive pixels negative for CPA, while area 3 comprises eGFP-positive pixels also positive for CPA. Area 1 comprises CPA-positive pixels negative for GFP. The percentage of all eGFP-positive pixels labeling for CPA in ptf1a:GFP transgenic pancreas (panel I; n=6) is 16.0 ± 3.1% (mean ± SD), compared to 2.4 ± 1.4% in ptf1a:GFP-KRASG12V transgenics (panel J; n=4; p<0.001, unpaired T-test).
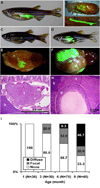
Fig. 4. Pancreatic tumor formation in adult Tg(ptf1a:GFP-KRASG12V) fish visualized by transcutaneous eGFP fluorescence
A, transcutaneous eGFP fluorescence in Tg(ptf1a:eGFP) fish, showing normal exocrine pancreas. B, low and high power image of dissected abdominal viscera from Tg(ptf1a:eGFP) fish, demonstrating multilobed pancreas interspersed between gut and other visceral organs. C–F. Transcutaneous (C,D) and visceral (E,F) fluorescence in Tg(ptf1a:GFP-KRASG12V) fish reveals eGFP-positive pancreatic tumors. Fish are designated as having either focal (C,E) or diffuse (D,F) fluorescence depending on tumor volume. G and H, histologic correlates of focal (G) and diffuse (H) transcutaneous eGFP fluorescence, confirming pancreatic tumors (note change in scale between G and H). I, proportion of randomly sampled Tg(ptf1a:GFP-KRASG12V) fish with detectable fluorescent tumors, demonstrating age-associated increase in tumor incidence and extent. Abbreviations: g, gut; t, tumor; li, liver.
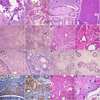
Fig. 5. Histological examination of normal adult zebrafish pancreas and _eGFP-KRASG12V_-induced pancreatic tumors
A–C, Normal pancreas in ptf1a:eGFP transgenics Arrowhead in (A) indicates pancreatic parenchyma surrounded by adipose tissue. D, increased size of exocrine pancreas (acinar hyperplasia) in Tg(ptf1a:eGFP-KRASG12V) fish with separate pancreatic tumor. E and F, Mixed adenocarcinoma with predominantly acinar cell differentiation and invasion of adjacent gut. Black arrowheads in F indicate base of intestinal crypt. G and H, Invasive adenocarcinoma with predominantly ductal differentiation and extensive desmoplastic reaction. Malignant glands are shown invading adjacent gut in H. Black arrowheads in H indicate base of intestinal crypt with adjacent goblet cells. I and J, adenocarcinoma with mixed acinar and glandular features. K and L, mucinous (colloid) adenocarcinoma. Note tumor cells floating in abundant pools of extracellular mucin. M and N, immunohistochemical detection of eGFP-KRASG12V expression in invasive adenocarcinoma invading adjacent gut. Image in (N) represents magnified view of boxed area in (M). Black arrowheads in (M) indicate normal interface between pancreas and intestine. Asterisk in (M) indicates ingested brine shrimp egg in the gut lumen. O, invasion of adjacent liver by ductal adenocarcinoma. P, isolated tumor deposit (asterisk) in ovary. Abbreviations: g, gut; p, pancreas; li, liver. Magnification: A, and M, 100x; B, E, G, I, K, and P, 200x; C, D, F, H, J, L, N, and O, 400x.
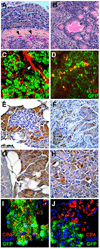
Fig. 6. Evaluation of differentiation and proliferation in normal adult zebrafish pancreas and _eGFP-KRASG12V_-induced pancreatic tumors
A, mucicarmine stain highlighting intracytoplasmic mucin in intestinal goblet cells, but not in adjacent normal pancreatic acinar cells (400x). B, Mucicarmine stain identifies intracytoplasmic and intralumenal mucin in a _eGFP-KRASG12V_-induced pancreatic tumor with ductal differentiation (400x). C and D (400x), immunofluorescent staining for Cytokeratin 18 reveals ductal elements in normal ptf1a:eGFP pancreas (C) and areas of ductal differentiation in _eGFP-KRASG12V_-induced pancreatic tumor (D). E and F (400x), immunohistochemical staining for amylase in normal pancreas (E) and _eGFP-KRASG12V_-induced pancreatic tumor (F). Normal pancreas demonstrates strong expression of amylase in exocrine acinar cells, but not in endocrine islet (central area). Tumor in (F) shows acinar-like features, with some cells staining positive for amylase. G and H (400x), immunohistochemical staining for carboxypeptidase A (CPA) in normal pancreas (G) and _eGFP-KRASG12V_-induced pancreatic tumor (F). Normal pancreas shows strong CPA expression in exocrine acinar cells. Tumor in (H) shows acinar-like features, with some cells staining positive for CPA. I and J (400X), immunofluorescent labeling for CPA in combination with eGFP fluorescence. G, normal pancreas from Tg(ptf1a:eGFP) fish, showing widespread CPA expression in eGFP-positive acinar cells. H, Pancreatic tumors from Tg(ptf1a:eGFP-KRASG12V) fish, demonstrating that cells with high-level CPA expression are negative for the ptf1a:eGFP-KRASG12V transgene.
Fig. 7. Assessment of ERK and AKT signaling in eGFP-KRASG12V-induced pancreatic tumors
A and B (200x), immunohistochemical detection of phosphorylated ERK in normal zebrafish gut and pancreas (A), and in eGFP-KRASG12V-induced pancreatic tumor (B). C and D, immunohistochemical detection of phosphorylated AKT in normal zebrafish gut and pancreas (C), and in eGFP-KRASG12V-induced pancreatic tumor (D). Arrowheads in A–D indicate labeling in intestinal crypts. E and F (400x), immunofluorescent labeling for phospho-histone H3 (PHH3), a marker of proliferation, in normal pancreas from Tg(ptf1a:eGFP) fish (E), and pancreatic tumor from Tg(ptf1a:eGFP-KRASG12V) fish (F). G, Phosphohistone H3-positive cells per high power field (mean ± SEM).
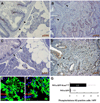
Fig. 8. Activation of hedgehog signaling pathway in eGFP-KRASG12V-induced pancreatic tumors
A and B, immunohistochemical stains for eGFP, showing transgene expression in exocrine pancreas of adult Tg(ptf1a:eGFP) fish (A, 400X) and in tumor from Tg(ptf1a:eGFP-KRASG12V) fish (B, 200X). C and D, immunohistochemical detection of Patched-2 in normal pancreas (C, 400X) and in _eGFP-KRASG12V_-induced pancreatic tumor (D, 200X). Patched-2 is expressed in tumor epithelium, but is confined to stromal elements in normal pancreas. E and F, in situ hybridization with eGFP probe detects eGFP expression in ptf1a:eGFP transgenic pancreas (E, 200X) and eGFP-KRASG12V expression in _ptf1a:eGFP-KRASG12V_-induced tumor (F, 200X). G and H, in situ hybridization for smoothened in normal pancreas (G, 200X) and in _eGFP-KRASG12V_-induced pancreatic tumor (H, 200X). Smoothened transcripts are detected in _eGFP-KRASG12V_-induced tumor, but not in normal pancreas. I and J, in situ hybridization for gli1 in normal pancreas (I, 200X) and _eGFP-KRASG12V_-induced pancreatic tumor (J, 200X). Transcripts for gli1 are detected in _eGFP-KRASG12V_-induced tumor, but not in normal pancreas. K, quantitative RT-PCR confirms upregulated expression of sonic hedgehog, desert hedgehog, indian hedgehog a, indian hedgehog b, patched-1, smoothened and gli1, and downregulated expression of trypsin in eGFP-KRASG12V–induced tumors relative to control pancreas. Values indicate mean ± SEM.
Similar articles
- Characterization of Kras-mediated pancreatic tumorigenesis in zebrafish.
Davison JM, Woo Park S, Rhee JM, Leach SD. Davison JM, et al. Methods Enzymol. 2008;438:391-417. doi: 10.1016/S0076-6879(07)38027-0. Methods Enzymol. 2008. PMID: 18413263 Review. - Zebrafish reporter lines reveal in vivo signaling pathway activities involved in pancreatic cancer.
Schiavone M, Rampazzo E, Casari A, Battilana G, Persano L, Moro E, Liu S, Leach SD, Tiso N, Argenton F. Schiavone M, et al. Dis Model Mech. 2014 Jul;7(7):883-94. doi: 10.1242/dmm.014969. Epub 2014 May 30. Dis Model Mech. 2014. PMID: 24878567 Free PMC article. - Screening pancreatic oncogenes in zebrafish using the Gal4/UAS system.
Liu S, Leach SD. Liu S, et al. Methods Cell Biol. 2011;105:367-81. doi: 10.1016/B978-0-12-381320-6.00015-1. Methods Cell Biol. 2011. PMID: 21951538 Free PMC article. - Oncogenic KRAS promotes malignant brain tumors in zebrafish.
Ju B, Chen W, Orr BA, Spitsbergen JM, Jia S, Eden CJ, Henson HE, Taylor MR. Ju B, et al. Mol Cancer. 2015 Feb 3;14(1):18. doi: 10.1186/s12943-015-0288-2. Mol Cancer. 2015. PMID: 25644510 Free PMC article. - Roles for KRAS in pancreatic tumor development and progression.
di Magliano MP, Logsdon CD. di Magliano MP, et al. Gastroenterology. 2013 Jun;144(6):1220-9. doi: 10.1053/j.gastro.2013.01.071. Gastroenterology. 2013. PMID: 23622131 Free PMC article. Review.
Cited by
- Distinct enhancers of ptf1a mediate specification and expansion of ventral pancreas in zebrafish.
Pashos E, Park JT, Leach S, Fisher S. Pashos E, et al. Dev Biol. 2013 Sep 15;381(2):471-81. doi: 10.1016/j.ydbio.2013.07.011. Epub 2013 Jul 20. Dev Biol. 2013. PMID: 23876428 Free PMC article. - Zebrafish Models of Paediatric Brain Tumours.
Basheer F, Dhar P, Samarasinghe RM. Basheer F, et al. Int J Mol Sci. 2022 Aug 31;23(17):9920. doi: 10.3390/ijms23179920. Int J Mol Sci. 2022. PMID: 36077320 Free PMC article. Review. - Iroquois Homeobox 1 Acts as a True Tumor Suppressor in Multiple Organs by Regulating Cell Cycle Progression.
Jung IH, Jung DE, Chung YY, Kim KS, Park SW. Jung IH, et al. Neoplasia. 2019 Oct;21(10):1003-1014. doi: 10.1016/j.neo.2019.08.001. Epub 2019 Aug 23. Neoplasia. 2019. PMID: 31450023 Free PMC article. - Zebrafish-based platform for emerging bio-contaminants and virus inactivation research.
Patel P, Nandi A, Verma SK, Kaushik N, Suar M, Choi EH, Kaushik NK. Patel P, et al. Sci Total Environ. 2023 May 10;872:162197. doi: 10.1016/j.scitotenv.2023.162197. Epub 2023 Feb 11. Sci Total Environ. 2023. PMID: 36781138 Free PMC article. Review. - Knockout of longevity gene Sirt1 in zebrafish leads to oxidative injury, chronic inflammation, and reduced life span.
Kim DH, Jung IH, Kim DH, Park SW. Kim DH, et al. PLoS One. 2019 Aug 6;14(8):e0220581. doi: 10.1371/journal.pone.0220581. eCollection 2019. PLoS One. 2019. PMID: 31386694 Free PMC article.
References
- Hruban RH, van Mansfeld AD, Offerhaus GJ, van Weering DH, Allison DC, Goodman SN, Kensler TW, Bose KK, Cameron JL, Bos JL. K-ras oncogene activation in adenocarcinoma of the human pancreas. A study of 82 carcinomas using a combination of mutant-enriched polymerase chain reaction analysis and allele-specific oligonucleotide hybridization. Am J Pathol. 1993;143:545–554. - PMC - PubMed
- Hingorani SR, Petricoin EF, Maitra A, Rajapakse V, King C, Jacobetz MA, Ross S, Conrads TP, Veenstra TD, Hitt BA, Kawaguchi Y, Johann D, Liotta LA, Crawford HC, Putt ME, Jacks T, Wright CV, Hruban RH, Lowy AM, Tuveson DA. Preinvasive and invasive ductal pancreatic cancer and its early detection in the mouse. Cancer Cell. 2003;4:437–450. - PubMed
- Hruban RH, Adsay NV, Albores-Saavedra J, Anver MR, Biankin AV, Boivin GP, Furth EE, Furukawa T, Klein A, Klimstra DS, Kloppel G, Lauwers GY, Longnecker DS, Luttges J, Maitra A, Offerhaus GJ, Perez-Gallego L, Redston M, Tuveson DA. Pathology of genetically engineered mouse models of pancreatic exocrine cancer: consensus report and recommendations. Cancer Res. 2006;66:95–106. - PubMed
Publication types
MeSH terms
Substances
LinkOut - more resources
Full Text Sources
Other Literature Sources
Medical
Molecular Biology Databases
Miscellaneous
