miR-375 targets 3'-phosphoinositide-dependent protein kinase-1 and regulates glucose-induced biological responses in pancreatic beta-cells - PubMed (original) (raw)
. 2008 Oct;57(10):2708-17.
doi: 10.2337/db07-1614. Epub 2008 Jun 30.
Affiliations
- PMID: 18591395
- PMCID: PMC2551681
- DOI: 10.2337/db07-1614
miR-375 targets 3'-phosphoinositide-dependent protein kinase-1 and regulates glucose-induced biological responses in pancreatic beta-cells
Abdelfattah El Ouaamari et al. Diabetes. 2008 Oct.
Abstract
Objective: MicroRNAs are short, noncoding RNAs that regulate gene expression. We hypothesized that the phosphatidylinositol 3-kinase (PI 3-kinase) cascade known to be important in beta-cell physiology could be regulated by microRNAs. Here, we focused on the pancreas-specific miR-375 as a potential regulator of its predicted target 3'-phosphoinositide-dependent protein kinase-1 (PDK1), and we analyzed its implication in the response of insulin-producing cells to elevation of glucose levels.
Research design and methods: We used insulinoma-1E cells to analyze the effects of miR-375 on PDK1 protein level and downstream signaling using Western blotting, glucose-induced insulin gene expression using quantitative RT-PCR, and DNA synthesis by measuring thymidine incorporation. Moreover, we analyzed the effect of glucose on miR-375 expression in both INS-1E cells and primary rat islets. Finally, miR-375 expression in isolated islets was analyzed in diabetic Goto-Kakizaki (GK) rats.
Results: We found that miR-375 directly targets PDK1 and reduces its protein level, resulting in decreased glucose-stimulatory action on insulin gene expression and DNA synthesis. Furthermore, glucose leads to a decrease in miR-375 precursor level and a concomitant increase in PDK1 protein. Importantly, regulation of miR-375 expression by glucose occurs in primary rat islets as well. Finally, miR-375 expression was found to be decreased in fed diabetic GK rat islets.
Conclusions: Our findings provide evidence for a role of a pancreatic-specific microRNA, miR-375, in the regulation of PDK1, a key molecule in PI 3-kinase signaling in pancreatic beta-cells. The effects of glucose on miR-375 are compatible with the idea that miR-375 is involved in glucose regulation of insulin gene expression and beta-cell growth.
Figures
FIG. 1.
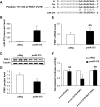
PDK1 is a target of miR-375. A: Scheme of the interaction between miR-375 and the 3′UTR of mouse, rat, and human PDK1. B: Quantification of miR-375 precursor levels. INS-1E cells were transfected with pNeg or pmiR-375 for 48 h. miR-375 precursor was then quantified by quantitative RT-PCR. Values for miR-375 precursor were normalized to U6 RNA. C: Analysis of PDK1 protein. INS-1E cells were transfected as above, and protein extracts were analyzed by Western blot using antibody to PDK1 or to β-tubulin. D: Relative quantification of PDK1 protein. Data represent three independent transfections done in triplicate, ±SE, with n = 3. *P < 0.05. E: Relative quantification of PDK1 mRNA levels. RNA extracts were used for quantitative RT-PCR analysis of PDK1 mRNA normalized to 36B4 mRNA. Data represent three independent transfections done in triplicate, ±SE, with n = 3. F: Study of the interaction between miR-375 and 3′UTR of PDK1 mRNA. INS-1E cells were cotransfected with one of the following pmiR-reporter luciferase vectors (Ambion): empty vector, vector containing the 3′UTR PDK-1 oligonucleotide predicted to interact with miR-375, or vector containing a mutated sequence. The cells were also transfected with either pmiR-375 or pNeg. Forty-eight hours after transfection, cells were assayed for luciferase and β-galactosidase activity; β-galactodidase was used as control to normalize for transfection efficiency. Data represent three independent transfections, each carried out in duplicate, ±SE, with n = 3. *P < 0.05.
FIG. 2.
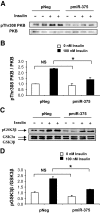
Effect of miR-375 on PKB and GSK3 phosphorylation. A: Analysis of Thr-308-phosphorylation of PKB. INS-1E cells were transfected with pNeg or pmiR-375. Forty-eight hours later, cells were starved in Krebs-Ringer bicarbonate HEPES medium for 2 h and either were or were not stimulated with 100 nmol/l insulin for 5 min. Protein extracts were analyzed by Western blot using antibody to phospho308Thr PKB and total PKB. B: Quantification of Thr-308-phosphorylated PKB. C: Analysis of GSK3β phosphorylation. Protein extracts were analyzed by Western blot using antibody to phosphoGSK3β and total GSK3. D: Quantification of phosphorylated GSK3β. The data presented correspond to three independent experiments, each done in duplicate, ±SE, with n = 3. *P < 0.05.
FIG. 3.
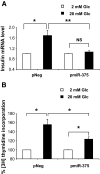
Effect of miR-375 on glucose-enhanced insulin gene expression and cell proliferation. A: Quantification of insulin mRNA. INS-1E cells were transfected as above. Forty-eight hours later, cells were starved in RPMI 1640 with 0.5% (vol/vol) FCS containing 2 mmol/l glucose for 16 h and treated with 2 or 20 mmol/l glucose for 1 h. Insulin mRNA expression was analyzed by quantitative RT-PCR and normalized to 36B4 transcript. Data represent five independent experiments carried out in triplicate, ±SE, with n = 5. *P < 0.05, **P < 0.005. B: Measurement of [methyl-3H]thymidine incorporation. INS-1E cells were transfected as above. Twenty-four hours later, cells were starved in RPMI 1640 with 0.5% (vol/vol) FCS containing 2 mmol/l glucose for 16 h and treated with 2 or 20 mmol/l glucose for 24 h, and cell proliferation was assessed by measuring [methyl-3H]thymidine incorporation. Data represent three independent experiments done in triplicate, ±SE, with n = 3. *P < 0.05.
FIG. 4.
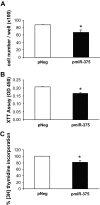
Effect of miR-375 on cell number, viability, and proliferation. A: Cell number counting. INS-1E cells were seeded in six-well plates (5 × 10⁵/well) and transfected with pNeg or premiR-375. Cells were starved in RPMI 1640 containing 0.5% (vol/vol) FCS and 11 mmol/l glucose for 24 h and then replaced in RPMI 1640 10% (vol/vol) FCS and 11 mmol/l glucose for 24 h. Cells were counted using Coulter counter. B: Cell viability assay. INS-1E cells were seeded in 12-well plates (2 × 10⁵/well) and transfected as above. Forty-eight hours later, cell viability was assessed as described in
research design and methods
. Data represent three independent transfections done in sextuplicate, ±SE, with n = 3. *P < 0.05. C: Measurement of [methyl-3H]thymidine incorporation. Cells were seeded in six-well plates (5 × 10⁵/well) and treated as in A. Cell proliferation was assessed by measuring [methyl-3H]thymidine incorporation. Data represent three independent experiments, each run in triplicate, ±SE, with n = 3. *P < 0.05.
FIG. 5.
Effect of 2′_-O-_methyl-miR-375 antisense oligonucleotides on PDK1, glucose-enhanced insulin mRNA, and cell proliferation. A: Analysis of PDK1 protein. INS-1E cells were transfected with indicated amounts of 2′_-O-_methyl-miR-375. After 48 h, protein extracts were analyzed by Western blot using antibody to PDK1 or to β-tubulin. B: Quantification of PDK1 protein. Data represent three independent transfections, ±SE, with n = 3. **P < 0.01. C: Quantification of insulin mRNA level. INS-1E cells were transfected with either 2′_-O-_methyl-GFP or 2′_-O-_methyl-miR-375 at 500 nmol/l. Twenty-four hours later, cells were starved in RPMI 1640 with 0.5% (vol/vol) FCS containing 2 mmol/l glucose for 16 h and treated with 2 or 20 mmol/l glucose for 1 h. RNA extracts were reverse-transcribed and analyzed by RT-PCR for the expression of insulin gene normalized to the 36B4 transcript level. Data represent three independent experiments done in triplicate, ±SE, with n = 3. *P < 0.05, **P < 0.01. D: Measurement of [methyl-3H]thymidine incorporation. INS-1E cells were transfected as described above. Twenty-four hours later, cells were starved in RPMI 1640 with 0.5% (vol/vol) FCS containing 2 mmol/l glucose for 16 h and treated with 2 or 20 mmol/l glucose for 24 h, and [methyl-3H]thymidine incorporation was measured. Data represent four independent experiments, done in triplicate, ±SE, with n = 4. *P < 0.05, ***P < 0.001.
FIG. 6.
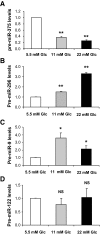
Expression of microRNAs in glucose-stimulated INS-1E cells. INS-1E cells were cultured in six-well plates (5 × 10⁵/well) and starved in RPMI 1640 with 0.5% (vol/vol) FCS containing 2 mmol/l glucose for 24 h and thereafter treated with 5.5, 11, or 22 mmol/l glucose for 4 days. RNA extracts were reverse-transcribed and analyzed by RT-PCR for the expression of miR-375 (A), miR-296 (B), miR-9 (C), and miR-122 (D) precursors. Expression levels of microRNA precursors were normalized to U6 transcript. Data represent three independent experiments each done in duplicate, ±SE, with n = 3. *P < 0.05, **P < 0.005. Results were expressed relative to the low glucose condition (5.5 mmol/l Glc).
FIG. 7.
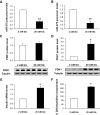
Effect of glucose on endogenous miR-375 and PDK1 expression in INS-1E cells. INS-1E cells were cultured in six-well plates (5 × 10⁵/well) and starved in RPMI 1640 with 0.5% (vol/vol) FCS containing 2 mmol/l glucose for 24 h and thereafter treated with 2 or 20 mmol/l glucose for 1 h (A) or 24 h (B). RNA extracts were analyzed for miR-375 precursor. Expression of miR-375 precursor was normalized to the U6 transcript level. Protein extracts from cells stimulated for 1 h (C) or 24 h (D) with 2 or 20 mmol/l glucose were analyzed by Western blot using antibody to PDK1 or to β-tubulin. INS-1E cells were starved in RPMI 1640 with 0.5% (vol/vol) FCS containing 2 mmol/l glucose for 16 h and treated with 2 or 20 mmol/l glucose for 1 h (E) or 24 h (F). Cell proliferation was assessed by measuring [methyl-3H]thymidine incorporation. Data represent three independent experiments done in triplicate, ±SE, with n = 3. *P < 0.05, **P < 0.005.
FIG. 8.
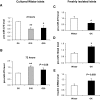
Study of endogenous miR-375 expression in freshly isolated rat islets. Rat islets were isolated as described in
research design and methods
. Islets were maintained overnight in Ham's F10 containing 1.8 g/l glucose supplemented with 300 mg/l glutamine, 100 mg/l streptomycin, 75 mg/l penicillin, 0.5% (wt/vol) BSA, and 2% (vol/vol) FCS. Thereafter, islets were treated with either 5, 10, or 20 mmol/l glucose for 2 h (A) or 72 h (B). RNA extracts were reverse-transcribed and analyzed by quantitative RT-PCR for miR-375 precursor. Expression of miR-375 precursor was normalized to the U6 transcript level. Results are means ± SE (n = 3/condition). *P < 0.05, **P < 0.005. Freshly isolated islets from Wistar (n = 5) and GK rats (n = 6) were prepared as previously described. RNA extracts were analyzed by quantitative RT-PCR for pre-miR-375 (C), pre-miR-124a2 (D), and insulin mRNA (E). Results are means ± SE (n = 5 for Wistar and n = 6 for GK), *P < 0.05.
Comment in
- Role of MicroRNA in pancreatic beta-cells: where more is less.
Walker MD. Walker MD. Diabetes. 2008 Oct;57(10):2567-8. doi: 10.2337/db08-0934. Diabetes. 2008. PMID: 18820213 Free PMC article. No abstract available.
Similar articles
- Increased expression of miR-187 in human islets from individuals with type 2 diabetes is associated with reduced glucose-stimulated insulin secretion.
Locke JM, da Silva Xavier G, Dawe HR, Rutter GA, Harries LW. Locke JM, et al. Diabetologia. 2014 Jan;57(1):122-8. doi: 10.1007/s00125-013-3089-4. Epub 2013 Oct 23. Diabetologia. 2014. PMID: 24149837 Free PMC article. - Differential glucose-regulation of microRNAs in pancreatic islets of non-obese type 2 diabetes model Goto-Kakizaki rat.
Esguerra JL, Bolmeson C, Cilio CM, Eliasson L. Esguerra JL, et al. PLoS One. 2011 Apr 7;6(4):e18613. doi: 10.1371/journal.pone.0018613. PLoS One. 2011. PMID: 21490936 Free PMC article. - Integrator of Stress Responses Calmodulin Binding Transcription Activator 1 (Camta1) Regulates miR-212/miR-132 Expression and Insulin Secretion.
Mollet IG, Malm HA, Wendt A, Orho-Melander M, Eliasson L. Mollet IG, et al. J Biol Chem. 2016 Aug 26;291(35):18440-52. doi: 10.1074/jbc.M116.716860. Epub 2016 Jul 8. J Biol Chem. 2016. PMID: 27402838 Free PMC article. - A new molecular target of insulin action: regulating the pivotal PDK1.
Wick KL, Liu F. Wick KL, et al. Curr Drug Targets Immune Endocr Metabol Disord. 2001 Nov;1(3):209-21. doi: 10.2174/1568008013341082. Curr Drug Targets Immune Endocr Metabol Disord. 2001. PMID: 12477287 Review. - miRNAs in the Beta Cell-Friends or Foes?
Karagiannopoulos A, Cowan E, Eliasson L. Karagiannopoulos A, et al. Endocrinology. 2023 Mar 13;164(5):bqad040. doi: 10.1210/endocr/bqad040. Endocrinology. 2023. PMID: 36869830 Free PMC article. Review.
Cited by
- Overexpression of Gjb4 impairs cell proliferation and insulin secretion in primary islet cells.
Gässler A, Quiclet C, Kluth O, Gottmann P, Schwerbel K, Helms A, Stadion M, Wilhelmi I, Jonas W, Ouni M, Mayer F, Spranger J, Schürmann A, Vogel H. Gässler A, et al. Mol Metab. 2020 Nov;41:101042. doi: 10.1016/j.molmet.2020.101042. Epub 2020 Jun 18. Mol Metab. 2020. PMID: 32565358 Free PMC article. - MiR-375 promotes redifferentiation of adult human β cells expanded in vitro.
Nathan G, Kredo-Russo S, Geiger T, Lenz A, Kaspi H, Hornstein E, Efrat S. Nathan G, et al. PLoS One. 2015 Apr 13;10(4):e0122108. doi: 10.1371/journal.pone.0122108. eCollection 2015. PLoS One. 2015. PMID: 25875172 Free PMC article. - β-cell preservation and regeneration for diabetes treatment: where are we now?
Karadimos MJ, Kapoor A, El Khattabi I, Sharma A. Karadimos MJ, et al. Diabetes Manag (Lond). 2012 May 1;2(3):213-222. doi: 10.2217/dmt.12.21. Diabetes Manag (Lond). 2012. PMID: 23049620 Free PMC article. - MicroRNAs: a new ray of hope for diabetes mellitus.
Kumar M, Nath S, Prasad HK, Sharma GD, Li Y. Kumar M, et al. Protein Cell. 2012 Oct;3(10):726-38. doi: 10.1007/s13238-012-2055-0. Epub 2012 Oct 11. Protein Cell. 2012. PMID: 23055040 Free PMC article. Review. - Mechanisms Underlying the Expansion and Functional Maturation of β-Cells in Newborns: Impact of the Nutritional Environment.
Jacovetti C, Regazzi R. Jacovetti C, et al. Int J Mol Sci. 2022 Feb 14;23(4):2096. doi: 10.3390/ijms23042096. Int J Mol Sci. 2022. PMID: 35216239 Free PMC article. Review.
References
- Stumvoll M, Goldstein BJ, van Haeften TW: Type 2 diabetes: principles of pathogenesis and therapy. Lancet 365: 1333–1346, 2005 - PubMed
- Ling Z, Wang Q, Stange G, In’t Veld P, Pipeleers D: Glibenclamide treatment recruits β-cell subpopulation into elevated and sustained basal insulin synthetic activity. Diabetes 55: 78–85, 2006 - PubMed
- Pipeleers D, Kiekens R, Ling Z, Wilikens A, Schuit F: Physiologic relevance of heterogeneity in the pancreatic beta-cell population. Diabetologia 37 (Suppl. 2): S57–S64, 1994 - PubMed
- Hugl SR, White MF, Rhodes CJ: Insulin-like growth factor I (IGF-I)-stimulated pancreatic beta-cell growth is glucose-dependent: synergistic activation of insulin receptor substrate-mediated signal transduction pathways by glucose and IGF-I in INS-1 cells. J Biol Chem 273: 17771–17779, 1998 - PubMed
Publication types
MeSH terms
Substances
LinkOut - more resources
Full Text Sources
Other Literature Sources
Molecular Biology Databases
Research Materials
Miscellaneous
