BSMART: a Matlab/C toolbox for analysis of multichannel neural time series - PubMed (original) (raw)
BSMART: a Matlab/C toolbox for analysis of multichannel neural time series
Jie Cui et al. Neural Netw. 2008 Oct.
Abstract
We have developed a Matlab/C toolbox, Brain-SMART (System for Multivariate AutoRegressive Time series, or BSMART), for spectral analysis of continuous neural time series data recorded simultaneously from multiple sensors. Available functions include time series data importing/exporting, preprocessing (normalization and trend removal), AutoRegressive (AR) modeling (multivariate/bivariate model estimation and validation), spectral quantity estimation (auto power, coherence and Granger causality spectra), network analysis (including coherence and causality networks) and visualization (including data, power, coherence and causality views). The tools for investigating causal network structures in respect of frequency bands are unique functions provided by this toolbox. All functionality has been integrated into a simple and user-friendly graphical user interface (GUI) environment designed for easy accessibility. Although we have tested the toolbox only on Windows and Linux operating systems, BSMART itself is system independent. This toolbox is freely available (http://www.brain-smart.org) under the GNU public license for open source development.
Figures
Figure 1
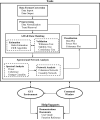
Functional block diagram of BSMART showing the main computational blocks and the algorithmic options. The core tools are shown in the dash-edged boxes. Different routines of the tools and help demonstrations can be invoked either from GUI environment or
Matlab
command window.
Figure 2
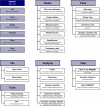
Top (shadowed) and second level menu structure of BSMART. The six main menus were designed to match different tasks of processing data and for common display functions. The dotted lines separate functionally different submenus.
Figure 3
Screen capture of a sample BSMART session running under Windows. Users call different functional blocks from the GUI interface (lower left) and input parameters via ‘pop-up’ parameter selection window (upper left). The results can be visualized with different plots such as waveform plot, time-frequency plot and network map (center and right).
Figure 4
The AIC as a function of model order, computed in a 60-ms time window (12 points at the sampling rate of 200 Hz) centered at 45 ms.
Figure 5
Results of model validation for the sample data set: (A) whiteness test; (B) stability test; and (C) consistency test.
Figure 6
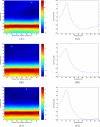
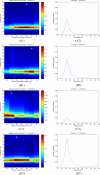
Auto power of the sample data set obtained by using the AMAR model. Time-frequency plots are shown in the left column and single spectra in the right column. The times of the single spectra in the right column are indicated by asterisks in the time-frequency plots. In panel A, (A1) shows the time-frequency plot of channel 9, and (A2) shows the spectrum of the time window centered at 55 ms, where the maximum power peak is found. Panel B shows the time-frequency plot of channel 10 and the spectrum of the window centered at 35 ms. Panel C shows the time-frequency plot of channel 11 and the spectrum of the window centered at 50 ms.
Figure 7
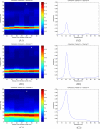
Ordinary coherence spectra among channels 9, 10 and 11 of the sample data set obtained by using the AMAR model. Time-frequency plots are shown in the left column and single spectra in the right column. The times of the single spectra in the right column are indicated by asterisks in the time-frequency plots. In panel A, the time-frequency coherence plot between channels 9 and 10 is shown in (A1), and (A2) shows the specific coherence spectrum of the window centered at 50 ms, in which the maximum coherence is reached. Panel B shows the time-frequency coherence plot between channels 9 and 11 and the coherence spectrum of the window centered at 55 ms. Panel C show coherence between channels 10 and 11, and the coherence spectrum of the window centered at 50 ms.
Figure 8
Directional influence measured as Granger causality among channels 9, 10 and 11. Time-frequency plots are shown in the left column and single spectra in the right column. The times of the single spectra in the right column are indicated by asterisks in the time-frequency plots. Panel A shows the causality from Channel 9 to Channel 10, where (A1) plots the time-frequency Granger causality plot and (A2) shows the spectrum in the time window centered at 50 ms, in which the maximum Granger causality was found. The causality from channel 9 to channel 11 is shown in panel B, where (B2) is the causality spectrum at 55 ms. Panel C and panel D show the causal influence from channel 11 to channel 9 and channel 11 to channel 10, respectively. (C2) is the spectrum at 35 ms and (D2) is the spectrum at 40 ms.
Figure 9
Coherence and Granger causality networks are shown in panel A and panel B, respectively, where (A1) and (B1) display the networks for the time window centered at 30 ms, and (A2) and (B2) for the window centered at 55 ms. Channel symbols circled in solid lines denote the channels under examination.
Similar articles
- GMAC: a Matlab toolbox for spectral Granger causality analysis of fMRI data.
Tana MG, Sclocco R, Bianchi AM. Tana MG, et al. Comput Biol Med. 2012 Oct;42(10):943-56. doi: 10.1016/j.compbiomed.2012.07.003. Epub 2012 Aug 25. Comput Biol Med. 2012. PMID: 22925560 - Neuroelectromagnetic forward modeling toolbox.
Akalin Acar Z, Makeig S. Akalin Acar Z, et al. Annu Int Conf IEEE Eng Med Biol Soc. 2008;2008:3991-4. doi: 10.1109/IEMBS.2008.4650084. Annu Int Conf IEEE Eng Med Biol Soc. 2008. PMID: 19163587 - Modeling visual working memory with the MemToolbox.
Suchow JW, Brady TF, Fougnie D, Alvarez GA. Suchow JW, et al. J Vis. 2013 Aug 20;13(10):9. doi: 10.1167/13.10.9. J Vis. 2013. PMID: 23962734 Free PMC article. - A portable platform to collect and review behavioral data simultaneously with neurophysiological signals.
Tianxiao Jiang, Siddiqui H, Ray S, Asman P, Ozturk M, Ince NF. Tianxiao Jiang, et al. Annu Int Conf IEEE Eng Med Biol Soc. 2017 Jul;2017:1784-1787. doi: 10.1109/EMBC.2017.8037190. Annu Int Conf IEEE Eng Med Biol Soc. 2017. PMID: 29060234 Review. - Causal influence: advances in neurosignal analysis.
Kaminski M, Liang H. Kaminski M, et al. Crit Rev Biomed Eng. 2005;33(4):347-430. doi: 10.1615/critrevbiomedeng.v33.i4.20. Crit Rev Biomed Eng. 2005. PMID: 15982186 Review.
Cited by
- Functional connectivity from the amygdala to the hippocampus grows stronger after stress.
Ghosh S, Laxmi TR, Chattarji S. Ghosh S, et al. J Neurosci. 2013 Apr 24;33(17):7234-44. doi: 10.1523/JNEUROSCI.0638-13.2013. J Neurosci. 2013. PMID: 23616532 Free PMC article. - Interacting humans use forces in specific frequencies to exchange information by touch.
Colomer C, Dhamala M, Ganesh G, Lagarde J. Colomer C, et al. Sci Rep. 2022 Sep 21;12(1):15752. doi: 10.1038/s41598-022-19500-1. Sci Rep. 2022. PMID: 36130972 Free PMC article. - Brain Connectivity Analysis Under Semantic Vigilance and Enhanced Mental States.
Al-Shargie F, Tariq U, Hassanin O, Mir H, Babiloni F, Al-Nashash H. Al-Shargie F, et al. Brain Sci. 2019 Dec 9;9(12):363. doi: 10.3390/brainsci9120363. Brain Sci. 2019. PMID: 31835346 Free PMC article. - Unconscious errors enhance prefrontal-occipital oscillatory synchrony.
Cohen MX, van Gaal S, Ridderinkhof KR, Lamme VA. Cohen MX, et al. Front Hum Neurosci. 2009 Nov 24;3:54. doi: 10.3389/neuro.09.054.2009. eCollection 2009. Front Hum Neurosci. 2009. PMID: 19956401 Free PMC article. - Prolonged high-altitude residence impacts verbal working memory: an fMRI study.
Yan X, Zhang J, Gong Q, Weng X. Yan X, et al. Exp Brain Res. 2011 Feb;208(3):437-45. doi: 10.1007/s00221-010-2494-x. Epub 2010 Nov 25. Exp Brain Res. 2011. PMID: 21107542 Clinical Trial.
References
- Blinowska KJ, Kus R, Kaminski M. Granger causality and information flow in multivariate processes. Physical Review E. 2004;70(5):1–4. - PubMed
- Box GEP, Jenkins GM, Reinsel GC. Time series analysis: forecasting and control. 3rd ed. Prentice Hall; Englewood Cliffs, N.J.: 1994.
- Bressler SL, Coppola R, Nakamura R. Episodic multiregional cortical coherence at multiple frequencies during visual task-performance. Nature. 1993;366(6451):153–156. - PubMed
- Brovelli A, Ding MZ, Ledberg A, Chen YH, Nakamura R, Bressler SL. Beta oscillations in a large-scale sensorimotor cortical network: Directional influences revealed by Granger causality. Proceedings of the National Academy of Sciences of the United States of America. 2004;101(26):9849–9854. - PMC - PubMed
- Delorme A, Makeig S. EEGLAB: an open source toolbox for analysis of single-trial EEG dynamics including independent component analysis. Journal of Neuroscience Methods. 2004;134(1):9–21. - PubMed
Publication types
MeSH terms
LinkOut - more resources
Full Text Sources
Other Literature Sources
Medical
Research Materials
