mTORC1 promotes survival through translational control of Mcl-1 - PubMed (original) (raw)
Comparative Study
. 2008 Aug 5;105(31):10853-8.
doi: 10.1073/pnas.0804821105. Epub 2008 Jul 29.
Yoshitaka Hippo, Francis Robert, Samuel M H Chen, Abba Malina, Chen-Ju Lin, Ulrike Trojahn, Hans-Guido Wendel, Al Charest, Roderick T Bronson, Scott C Kogan, Robert Nadon, David E Housman, Scott W Lowe, Jerry Pelletier
Affiliations
- PMID: 18664580
- PMCID: PMC2504845
- DOI: 10.1073/pnas.0804821105
Comparative Study
mTORC1 promotes survival through translational control of Mcl-1
John R Mills et al. Proc Natl Acad Sci U S A. 2008.
Abstract
Activation of the phosphatidylinositol 3-kinase (PI3K)/AKT signaling pathway is a frequent occurrence in human cancers and a major promoter of chemotherapeutic resistance. Inhibition of one downstream target in this pathway, mTORC1, has shown potential to improve chemosensitivity. However, the mechanisms and genetic modifications that confer sensitivity to mTORC1 inhibitors remain unclear. Here, we demonstrate that loss of TSC2 in the E mu-myc murine lymphoma model leads to mTORC1 activation and accelerated oncogenesis caused by a defective apoptotic program despite compromised AKT phosphorylation. Tumors from Tsc2(+/-)E mu-Myc mice underwent rapid apoptosis upon blockade of mTORC1 by rapamycin. We identified myeloid cell leukemia sequence 1 (Mcl-1), a bcl-2 like family member, as a translationally regulated genetic determinant of mTORC1-dependent survival. Our results indicate that the extent by which rapamycin can modulate expression of Mcl-1 is an important feature of the rapamycin response.
Conflict of interest statement
The authors declare no conflict of interest.
Figures
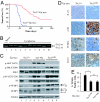
Fig. 1.
_Tsc2LOHE_μ-myc tumors display accelerated lymphomagenesis and activated mTORC1 signaling. (A) Kaplan–Meier plot illustrating differences in tumor latencies between Tsc2+/+_E_μ-myc (red, n = 41) and Tsc2+/−_E_μ-myc (blue, n = 29) mice (P < 0.001 as determined by log rank analysis). (B) PCR to detect LOH at the Tsc2 locus in Tsc2+/−_E_μ-myc tumors (wt, wild-type allele; mt, mutant allele). (C) Western blot analysis of _E_μ-myc tumors of the indicated genotypes probed for activation of AKT-mTOR signaling (_p_-AKT, α-tubulin, and phosphorylated and total S6K1, S6, and 4E-BP1). (D) Representative micrographs of Tsc2+/+_E_μ-myc and _Tsc2LOHE_μ-myc tumor sections stained with H&E, by TUNEL, and for Ki-67. (E) Loss of TSC2 blocks MYC-induced apoptosis to the same extent as AKT activation. The percentage of cells staining positive for TUNEL from Tsc2+/+_E_μ-myc (n = 4), _Tsc2LOHE_μ-myc (n = 3), or _E_μ-myc/myr-Akt (n = 3) tumors is shown. Tumor tissue sections from three independent animals were analyzed, with three randomly selected fields (≈500 cells) analyzed for TUNEL signal. Error bars represent the SD. ∗, P < 0.001; ∗∗, P ≈0.4 as determined by Student's t test.
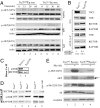
Fig. 2.
Activation of mTORC1 leads to defective AKT phosphorylation in MYC-induced lymphomagenesis. (A) Tumors of the indicated genotype were cultured ex vivo and stimulated with 100 nM insulin, 10 μg/ml LPS, or 10 μg/ml IgM. Extracts were prepared and probed for AKT (total and _p_-S473) and ACTIN. (B) The distribution of mTOR among mTORC1 and mTORC2 is altered in _Tsc2LOHE_μ-myc tumors. Tsc2+/+_E_μ-myc and _Tsc2LOHE_μ-myc tumors were analyzed for total levels of mTOR, RICTOR, and RAPTOR. MTOR-containing complexes were immunoprecipitated from _E_μ-myc tumors of the indicated genotypes, and RICTOR and RAPTOR levels were assessed by Western blotting. (Top) Total levels of mTOR, RICTOR, and RAPTOR in whole-cell extracts. (Bottom) Amounts of RICTOR and RAPTOR coprecipitating (Co-IP) with mTOR. The quantitation of mTORC2:mTORC1 ratios in three tumors of the indicated genotype is shown and represents the average of three experiments ±SD. (C) Tsc2+/+_E_μ-myc and _Tsc2LOHE_μ-myc tumors were analyzed for levels of RICTOR-associated mTOR. (D) Amounts of RICTOR and RAPTOR associating with mTOR in _E_μ-myc, Tsc2LOH, myr-Akt, and Pten+/−_E_μ-myc tumors. (E) AKT (S473) phosphorylation is decreased in _Tsc2LOHE_μ-myc tumors. Extracts prepared from MSCV/myr-_Akt_-infected Tsc2+/+_E_μ-myc or _Tsc2LOHE_μ-myc tumors were analyzed by Western blotting for AKT (total and _p_-S473), S6 (total and _p_-S235/236), and tubulin. AKT and myr-AKT are denoted by an arrow and arrowhead, respectively.
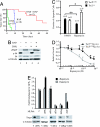
Fig. 3.
Rapamycin and doxorubicin cooperatively induce apoptosis in _Tsc2LOHE_μ-myc tumors. (A) Kaplan–Meier plot detailing the time to relapse after treatment of mice bearing _Tsc2LOHE_μ-Myc tumors with Dxr, Rap, or a combination of both (Dxr + Rap). P < 0.001 for significance among all curves as determined by log rank test. (B) Extracts prepared from _Tsc2LOHE_μ-myc tumors treated with Rap, Dxr, or combination treatment were probed for cleaved PARP (cPARP), tubulin, and rpS6 (S6 and _p_-S235/236). (C) _Tsc2LOHE_μ-myc tumors are more sensitive to _Rap_-induced apoptosis than Tsc2+/+_E_μ-myc tumors. _E_μ-myc derived tumors (Tsc2+/+ or Tsc2LOH) were cultured ex vivo in the presence of vehicle or 1 nM Rap for 32 h. Propidium iodide and annexin V staining was used to quantify induction of apoptosis. ∗, P < 0.0007; ∗∗, P ≈0.2 as determined by Student's t test. (D) _Tsc2LOHE_μ-myc tumors are more sensitive to growth inhibition than Tsc2+/+_E_μ-myc tumors. Cells were cultured ex vivo in the presence of the indicated concentrations of Rap for 24 h and viability determined by using an MTS assay (Promega). Viability is standardized to nontreated controls (n = 3). (E) mTORC1, not mTORC2, dictates sensitivity to Rap in _Tsc2LOHE_μ-myc lymphomas. (Upper) _Tsc2LOHE_μ-myc lymphomas were cultured ex vivo and transduced with the indicated MLP-based shRNA vectors. The percentage viable GFP+ cells was measured after a 60-h exposure to 50 pM rapamycin or vehicle alone. The results are expressed relative to percentage GFP+ cells present before rapamycin exposure (which was arbitrarily set at 1). Shown are averaged over three experiments, and error bars represent the SEM. (Lower) Immunoblots verifying knockdown of target proteins using the indicated MSCV-based shRNA retroviral vectors in NIH 3T3 cells.
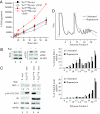
Fig. 4.
Rapamycin decreases expression of MCL-1 in _Tsc2LOHE_μ-myc tumors. (A) _E_μ-_myc_-derived tumors (Tsc2+/+ or Tsc2LOH) were cultured ex vivo in the presence of vehicle or 10 nM Rap for 2 h followed by [35S]Met labeling for the indicated times. Error bars represent SD (n = 2). (B) Rap treatment of _Tsc2LOHE_μ-myc tumors impairs recruitment of eIF4GI into the eIF4F complex. Extracts from _Tsc2LOHE_μ-myc and Tsc2+/+_E_μ-myc tumors were applied to m7GDP affinity resins and washed, and m7GTP eluents were probed for eIF4GI, eIF4E, and 4E-BP1. (C) Expression of Mcl-1 is mTOR-dependent in _Tsc2LOHE_μ-myc cells. After 1 h of Rap treatment, MCL-1 levels were determined by Western blotting. (D) Translation of Mcl-1 is inhibited by Rap. Polysome profiles from _Tsc2LOHE_μ-myc tumors grown ex vivo and exposed to 10 nM Rap for 2 h are shown. RNA was isolated from polysome fractions and subjected to quantitative RT-PCR analysis. The relative amount of Mcl-1 or β-actin mRNA in each fraction is expressed as a percentage of the total in the polysome gradient. Quantitative RT-PCRs were performed in duplicate, and the error bars represent the SEM. Shown is one of three representative experiments performed on different polysome gradients.
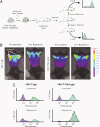
Fig. 5.
Mcl-1 is a genetic modifier of rapamycin sensitivity in vivo. (A) Schematic representation of the in vivo competition experimental design. (B) Freshly isolated _Tsc2LOHE_μ-myc tumors were transduced ex vivo with MSCV/gfp or MSCV/Mcl-1/gfp virus and introduced into syngenic mice. Upon tumor formation, the GFP content of tumors was determined by fluorescence whole-body scanning with the GE eXplore Optix. The fluorescence signal in each animal was analyzed before and 12 h after a single dose of Rap. The intensity of the GFP signal is depicted by color according the bar scale at the right. (C) Representative flow cytometry analysis of GFP expression in _Tsc2LOHE_μ-myc tumors expressing gfp and Mcl-1 in the viable portion of tumors harvested 12 h after Rap exposure.
Similar articles
- mTORC1 hyperactivity inhibits serum deprivation-induced apoptosis via increased hexokinase II and GLUT1 expression, sustained Mcl-1 expression, and glycogen synthase kinase 3beta inhibition.
Bhaskar PT, Nogueira V, Patra KC, Jeon SM, Park Y, Robey RB, Hay N. Bhaskar PT, et al. Mol Cell Biol. 2009 Sep;29(18):5136-47. doi: 10.1128/MCB.01946-08. Epub 2009 Jul 20. Mol Cell Biol. 2009. PMID: 19620286 Free PMC article. - Concurrent inhibition of PI3K and mTORC1/mTORC2 overcomes resistance to rapamycin induced apoptosis by down-regulation of Mcl-1 in mantle cell lymphoma.
Müller A, Zang C, Chumduri C, Dörken B, Daniel PT, Scholz CW. Müller A, et al. Int J Cancer. 2013 Oct 15;133(8):1813-24. doi: 10.1002/ijc.28206. Epub 2013 Jun 15. Int J Cancer. 2013. PMID: 23580240 - Mammalian target of rapamycin complex 1 (mTORC1) enhances bortezomib-induced death in tuberous sclerosis complex (TSC)-null cells by a c-MYC-dependent induction of the unfolded protein response.
Babcock JT, Nguyen HB, He Y, Hendricks JW, Wek RC, Quilliam LA. Babcock JT, et al. J Biol Chem. 2013 May 31;288(22):15687-98. doi: 10.1074/jbc.M112.431056. Epub 2013 Apr 23. J Biol Chem. 2013. PMID: 23612979 Free PMC article. - Mammalian target of rapamycin and tuberous sclerosis complex.
Wataya-Kaneda M. Wataya-Kaneda M. J Dermatol Sci. 2015 Aug;79(2):93-100. doi: 10.1016/j.jdermsci.2015.04.005. Epub 2015 Apr 25. J Dermatol Sci. 2015. PMID: 26051878 Review. - Deconstructing feedback-signaling networks to improve anticancer therapy with mTORC1 inhibitors.
Carracedo A, Baselga J, Pandolfi PP. Carracedo A, et al. Cell Cycle. 2008 Dec 15;7(24):3805-9. doi: 10.4161/cc.7.24.7244. Epub 2008 Dec 22. Cell Cycle. 2008. PMID: 19098454 Free PMC article. Review.
Cited by
- A cellular response linking eIF4AI activity to eIF4AII transcription.
Galicia-Vázquez G, Cencic R, Robert F, Agenor AQ, Pelletier J. Galicia-Vázquez G, et al. RNA. 2012 Jul;18(7):1373-84. doi: 10.1261/rna.033209.112. Epub 2012 May 15. RNA. 2012. PMID: 22589333 Free PMC article. - Overexpression of HSP10 correlates with HSP60 and Mcl-1 levels and predicts poor prognosis in non-small cell lung cancer patients.
Tang Y, Yang Y, Luo J, Liu S, Zhan Y, Zang H, Zheng H, Zhang Y, Feng J, Fan S, Wen Q. Tang Y, et al. Cancer Biomark. 2021;30(1):85-94. doi: 10.3233/CBM-200410. Cancer Biomark. 2021. PMID: 32986659 Free PMC article. - Synergistic activity of rapamycin and dexamethasone in vitro and in vivo in acute lymphoblastic leukemia via cell-cycle arrest and apoptosis.
Zhang C, Ryu YK, Chen TZ, Hall CP, Webster DR, Kang MH. Zhang C, et al. Leuk Res. 2012 Mar;36(3):342-9. doi: 10.1016/j.leukres.2011.10.022. Epub 2011 Dec 3. Leuk Res. 2012. PMID: 22137317 Free PMC article. - The mTORC1 inhibitor everolimus prevents and treats Eμ-Myc lymphoma by restoring oncogene-induced senescence.
Wall M, Poortinga G, Stanley KL, Lindemann RK, Bots M, Chan CJ, Bywater MJ, Kinross KM, Astle MV, Waldeck K, Hannan KM, Shortt J, Smyth MJ, Lowe SW, Hannan RD, Pearson RB, Johnstone RW, McArthur GA. Wall M, et al. Cancer Discov. 2013 Jan;3(1):82-95. doi: 10.1158/2159-8290.CD-12-0404. Epub 2012 Dec 14. Cancer Discov. 2013. PMID: 23242809 Free PMC article. - Mechanisms of MCL-1 Protein Stability Induced by MCL-1 Antagonists in B-Cell Malignancies.
Tantawy SI, Sarkar A, Hubner S, Tan Z, Wierda WG, Eldeib A, Zhang S, Kornblau S, Gandhi V. Tantawy SI, et al. Clin Cancer Res. 2023 Jan 17;29(2):446-457. doi: 10.1158/1078-0432.CCR-22-2088. Clin Cancer Res. 2023. PMID: 36346691 Free PMC article.
References
- Guertin DA, Sabatini DM. Defining the role of mTOR in cancer. Cancer Cell. 2007;12:9–22. - PubMed
- Hay N, Sonenberg N. Upstream and downstream of mTOR. Genes Dev. 2004;18:1926–1945. - PubMed
- Dorrello NV, et al. S6K1- and β-TRCP-mediated degradation of PDCD4 promotes protein translation and cell growth. Science. 2006;314:467–471. - PubMed
- Sarbassov DD, et al. Prolonged rapamycin treatment inhibits mTORC2 assembly and Akt/PKB. Mol Cell. 2006;22:159–168. - PubMed
Publication types
MeSH terms
Substances
LinkOut - more resources
Full Text Sources
Other Literature Sources
Medical
Molecular Biology Databases
Research Materials
