Targeted cleavage of signaling proteins by caspase 3 inhibits T cell receptor signaling in anergic T cells - PubMed (original) (raw)
Targeted cleavage of signaling proteins by caspase 3 inhibits T cell receptor signaling in anergic T cells
Irene Puga et al. Immunity. 2008.
Abstract
T cell receptor (TCR) engagement in the absence of costimulation induces the calcium-dependent upregulation of a program of gene expression that leads to the establishment of T cell anergy. Casp3 is one of the genes activated during anergy induction. Here we show that caspase 3 is required for the induction of T cell unresponsiveness. Suboptimal T cell stimulation induced caspase 3 activation, which did not result in cell death. Furthermore, caspase 3-deficient T cells showed impaired responses to anergizing stimuli. In anergic T cells, activated caspase 3 associated to the plasma membrane, where it cleaved and inactivated proteins such as the Grb2-related adaptor downstream of shc (GADS) and the guanine-nucleotide exchange factor Vav1, causing a blockade in TCR signaling. Our results identify a role for caspase 3 in nonapoptotic T cells and support that caspase 3-dependent proteolytic inactivation of signaling proteins is essential to maintain T cell tolerance.
Figures
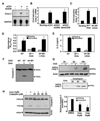
Figure 1. Anergic cells activate caspase 3
Th1 cells were stimulated with antiCD3 and/or antiCD28 for 6 hours and caspase 3 mRNA measured by (A) RNase protection assay or (B) qPCR. Where indicated, cells treated with antiCD3 received antiCD28 with a two-hour delay (delαCD28). Results (mean+SEM) are fold induction of mRNA expression relative to the control resting cells from at least 4 experiments. C. DO11.10 Th1 cells were cocultured for 6 hours with CHO-IAd cells loaded or not with OVA, or fully stimulated with OVA-loaded CHO-IAd-B7 cells. Levels of caspase 3 mRNA were analyzed by qPCR. Results are mean+SEM of 3 experiments. D and E. DO11.10 Th1 cells were cocultured for 12 hours with CHO-IAd cells, loaded or not with OVA or with OVA-loaded CHO-IAd–B7 cells. After a 3-day resting period, cells were stimulated with antiCD3+antiCD28 and (D) BrdU incorporation and (E) IL-2 production measured. Bars show mean+SEM from at least 3 experiments. F. Th1 cells were treated as described in (D) and caspase 3 processing detected by western blot. G. Th1 cells were stimulated with OVA-loaded CHO-IAd (upper panel) or ionomycin (lower panel). Processing of caspase 3 was measured at different time points using a specific antibody for its active form. Actin was detected as a loading control. H. Th1 cells were treated with ionomycin for 6 hours in the presence of calpeptin or control vehicle (DMSO). Caspase 3 activation was detected by western blot. Actin was detected as a loading control. Densitometric quantifications of two independent experiments are shown (mean+SEM).
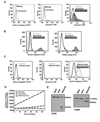
Figure 2. Activation of Caspase 3 does not induce apoptosis in anergic T cells
A. DO11.10 Th1 cells treated with ionomycin or left resting for 12 hours. T cells were then recovered, washed, stained with an antibody against the active form of caspase 3 (left panel) or with Annexin V-PE (center panel) and analyzed by FACS. T cells treated with staurosporine (1µM, 4 hours) were used as positive control for Annexin V-PE staining (right panel). B. Levels of apoptosis were also detected by TUNEL assay in Th1 cells treated with 1µM ionomycin for 12 hours or with staurosporine for 4 hours. The same cells were also stained for active caspase 3 (left panel). C. Similar analyses were performed in T cells cultured for 12 hours with CHO-IAd cells loaded or not with OVA. D. Caspase 3 activity was measured using a fluorogenic caspase-3 substrate in cell lysates from Th1 cells left resting, anergized with ionomycin for 12 hours or treated with 1µM staurosporine for 4 hours. E. Th1 cells were left resting, incubated with 1µM ionomycin for 12 hours or treated with 1µM staurosporine for 4 hours. Total cell lysates were and analyzed by western blot using antibodies that recognized the proapoptotic caspase 3 substrates PARP and ICAD.
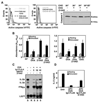
Figure 3. Inhibition of caspase activity compromises anergy induction in T cells
A and B. DO11.10 Th1 cells were anergized by coculture for 12 hours with OVA-loaded CHO-IAd cells. Z-VAD or control vehicle (DMSO) were added where indicated. Th1 cells cocultured with CHO-IAd cells or with OVA-loaded CHO-IAd-B7 cells were used as controls. (A) Z-VAD inhibition of caspase 3 activation was determined by intracellular staining for active caspase 3 or western blot. (B) Level of anergy following treatments was determined by measuring BrdU incorporation after antiCD3+antiCD28 stimulation. C and D. DO11.10 Th1 cells were anergized with irradiated splenocytes preincubated with OVA and CTLA-4-Ig. Z-VAD was added where indicated. After 12h, T cells were recovered, washed and rested for 3 days before re-stimulation with antiCD3+antiCD28. IL-2 production was measured by (C) RNase protection assay or (D) ELISA. Untreated control cells were also analyzed. S: stimulated. R: resting. Values are mean+SEM of at least 3 different experiments.
Figure 4. Blocking caspase 3 expression interferes with the induction of anergy
A. Th1 cells were transfected with a GFP expressing vector only or together with the pC3RNAi, which expresses a specific caspase 3 shRNA, or control pSup vector. Cells were then sorted for GFP expression, left resting or treated with 1µM ionomycin for 12 hours, and caspase 3 and actin were detected by western blot. B. Control and ionomycin-treated caspase 3 knocked-down cells were stimulated with antiCD3+antiCD28 and IL-2 production measured by ELISA. Bars show percentage of IL-2 expression relative to control stimulated cells, and are mean+SEM of 3 experiments. **=p<0.01. C. CD4+ T cells were isolated from casp3−/− mice and wild-type littermates. Absence of caspase 3 expression in C_asp3_−/− cells was confirmed by western blot. T cells were differentiated under Th1 skewing conditions and then left resting or treated with 1µM ionomycin for 12 hours. Cells were then washed and left resting for 6–8 hours before re-stimulation with antiCD3+antiCD28. Inhibition of IL-2 production in C_asp3_−/− T cells was compared with that of wild type anergized T cells. Bars show percentage of IL-2 expression in anergic cells compared with control stimulated cells, and are mean+SEM of 6 mice. *=p<0.05.
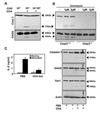
Figure 5. Caspase 3 cleaves GADS and Vav1 in anergic T cells
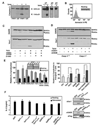
A. DO11.10 Th1 cells were cocultured for 12 hours with CHO-IAd cells loaded or not with OVA, or with OVA-loaded CHO-IAd-B7 cells. T cells were then recovered and caspase 3 and GADS processing determined. B. Casp3−/− and wild-type littermates Th1 cells were treated for 12 hours with ionomycin and processing of caspase 3 and GADS detected by western blot. C. DO11.10 mice were orally tolerized with ovalbumin. Seven days later, CD4+ cells were isolated and stimulated with antiCD3+antiCD28. IL-2 production was measured by ELISA. Proteolytic cleavage of caspase 3, GADS and Vav1 was determined by western blot. Results are from two different mice from each group (mean+SEM).
Figure 6. Active caspase 3 associates to the plasma membrane in anergic T cells where it cleaves GADS and Vav1 following TCR stimulation
A. S100 fractions were prepared from resting Th1 cells or cells treated with 1µM ionomycin for 12 hours (left panel). Lysates from those cells were also fractionated by differential centrifugation in sucrose gradients into fractions containing the plasma membrane (P1), mitochondria, lysosomes, endosomes and peroxisomes (P2) and the Golgi and ER (P3) (right panel). The presence of active caspase 3 in all fractions was detected by western blot. B and C. Th1 cells from Casp3−/− or wild type mice were treated with 1µM ionomycin for 12 hours, washed and rested for 4 hours before stimulation with antiCD3+antiCD28 for 6 hours. Annexin V staining was detected by FACS in stimulated cells (B) and proteolytic processing of GADS and Vav1 determined in lysates from these cells (C). D. Th1 cells were left untreated or treated with 1µM ionomycin for 16 hours, washed and left resting for 4 hours before re-stimulation, in the presence or absence of Z-VAD. After 6 hours, cells were collected and proteolytic cleavage of GADS and Vav1 detected by western blot. E. Th1 cells from C57BL6/J mice were transfected with plasmids expressing wild-type or caspase-resistant (GADSr and Vav1r) murine GADS and/or Vav1. Amounts of DNA used were adjusted to obtain similar levels of expression (inset). Control cells were transfected with pGFP. 36 hours post-transfection, cells were rested or treated with ionomycin 1µM for 12 hours. IL-2 was measured by ELISA after stimulation with antiCD3+antiCD28. Left panel shows normalized (to control untreated cells) IL-2 values, whereas right panel shows percentage of IL-2 expression in anergic cells compared with control cells in each experimental condition. Bars are mean+SEM of 4 experiments. *p<0.05. F. Th1 cells were transduced with retrovirus expressing the N-terminal (Vav11–174, GADS1–223) and/or the C-terminal (Vav1172–845, GADS226–322) fragments of Vav1 and GADS. Expression of these peptides was verified by western blot in infected NIH3T3 cells. IL-2 production was measured in sorted T cells after stimulation with antiCD3+antiCD28. Bars are mean+SEM of at least 2 experiments.
Figure 7. Caspase 3–mediated cleavage prevents activation-dependent recruitment of Vav1 to the membrane in anergic T cells
**A.**Vav1 membrane recruitment was determined by western blot of pellet (mem) and supernatant (cyt) S100 fractions of control and anergic Th1 cells stimulated with antiCD3+antiCD28. Detection of flotillin1 was used as a membrane marker. B. Th1 cells, transduced with virus expressing wild-type or caspase-resistant (Vav1r) Vav1, were sorted and the translocation of Vav1 to the membrane in control and anergized cells determined after stimulation with antiCD3+antiCD28. Densitometric quantification of six experiments is shown. **p<0.01, *p<0.05.
Similar articles
- Proteome analysis reveals caspase activation in hyporesponsive CD4 T lymphocytes induced in vivo by the oral administration of antigen.
Kaji T, Hachimura S, Ise W, Kaminogawa S. Kaji T, et al. J Biol Chem. 2003 Jul 25;278(30):27836-43. doi: 10.1074/jbc.M212820200. Epub 2003 May 7. J Biol Chem. 2003. PMID: 12736267 - TCR and CD28 are coupled via ZAP-70 to the activation of the Vav/Rac-1-/PAK-1/p38 MAPK signaling pathway.
Salojin KV, Zhang J, Delovitch TL. Salojin KV, et al. J Immunol. 1999 Jul 15;163(2):844-53. J Immunol. 1999. PMID: 10395678 - The sound of silence: modulating anergy in T lymphocytes.
Saibil SD, Deenick EK, Ohashi PS. Saibil SD, et al. Curr Opin Immunol. 2007 Dec;19(6):658-64. doi: 10.1016/j.coi.2007.08.005. Epub 2007 Oct 18. Curr Opin Immunol. 2007. PMID: 17949964 Review. - Vav1: a key signal transducer downstream of the TCR.
Tybulewicz VL, Ardouin L, Prisco A, Reynolds LF. Tybulewicz VL, et al. Immunol Rev. 2003 Apr;192:42-52. doi: 10.1034/j.1600-065x.2003.00032.x. Immunol Rev. 2003. PMID: 12670394 Review.
Cited by
- NFAT, immunity and cancer: a transcription factor comes of age.
Müller MR, Rao A. Müller MR, et al. Nat Rev Immunol. 2010 Sep;10(9):645-56. doi: 10.1038/nri2818. Epub 2010 Aug 20. Nat Rev Immunol. 2010. PMID: 20725108 Review. - RhoG's Role in T Cell Activation and Function.
Ahmad Mokhtar AM, Salikin NH, Haron AS, Amin-Nordin S, Hashim IF, Mohd Zaini Makhtar M, Zulfigar SB, Ismail NI. Ahmad Mokhtar AM, et al. Front Immunol. 2022 Feb 25;13:845064. doi: 10.3389/fimmu.2022.845064. eCollection 2022. Front Immunol. 2022. PMID: 35280994 Free PMC article. Review. - Silencing of the Il2 gene transcription is regulated by epigenetic changes in anergic T cells.
Bandyopadhyay S, Montagna C, Macian F. Bandyopadhyay S, et al. Eur J Immunol. 2012 Sep;42(9):2471-83. doi: 10.1002/eji.201142307. Epub 2012 Jul 13. Eur J Immunol. 2012. PMID: 22684523 Free PMC article. - Glycolysis promotes caspase-3 activation in lipid rafts in T cells.
Secinaro MA, Fortner KA, Dienz O, Logan A, Murphy MP, Anathy V, Boyson JE, Budd RC. Secinaro MA, et al. Cell Death Dis. 2018 Jan 19;9(2):62. doi: 10.1038/s41419-017-0099-z. Cell Death Dis. 2018. PMID: 29352186 Free PMC article. - ScreenCap3: Improving prediction of caspase-3 cleavage sites using experimentally verified noncleavage sites.
Fu SC, Imai K, Sawasaki T, Tomii K. Fu SC, et al. Proteomics. 2014 Sep;14(17-18):2042-6. doi: 10.1002/pmic.201400002. Epub 2014 Aug 4. Proteomics. 2014. PMID: 24995852 Free PMC article.
References
- Algeciras-Schimnich A, Barnhart BC, Peter ME. Apoptosis-independent functions of killer caspases. Current Opinion in Cell Biology. 2002;14:721–726. - PubMed
- Anandasabapathy N, Ford GS, Bloom D, Holness C, Paragas V, Seroogy C, Skrenta H, Hollenhorst M, Fathman CG, Soares L. GRAIL: An E3 Ubiquitin Ligase that Inhibits Cytokine Gene Transcription Is Expressed in Anergic CD4+ T Cells. Immunity. 2003;18:535–547. - PubMed
- Bae SS, Perry DK, Oh YS, Choi JH, Galadari SH, Ghayur T, Ryu SH, Hannun YA, Suh PG. Proteolytic cleavage of phospholipase C-gamma1 during apoptosis in Molt-4 cells. FASEB J. 2000;14:1083–1092. - PubMed
Publication types
MeSH terms
Substances
Grants and funding
- AI48213/AI/NIAID NIH HHS/United States
- R56 AI059738/AI/NIAID NIH HHS/United States
- AI059738/AI/NIAID NIH HHS/United States
- R01 AI048213/AI/NIAID NIH HHS/United States
- R01 AI048213-01/AI/NIAID NIH HHS/United States
- R01 AI059738/AI/NIAID NIH HHS/United States
- R01 AI059738-01/AI/NIAID NIH HHS/United States
LinkOut - more resources
Full Text Sources
Other Literature Sources
Molecular Biology Databases
Research Materials
Miscellaneous
