Comprehensive genomic characterization defines human glioblastoma genes and core pathways - PubMed (original) (raw)
. 2008 Oct 23;455(7216):1061-8.
doi: 10.1038/nature07385. Epub 2008 Sep 4.
Collaborators
- PMID: 18772890
- PMCID: PMC2671642
- DOI: 10.1038/nature07385
Comprehensive genomic characterization defines human glioblastoma genes and core pathways
Cancer Genome Atlas Research Network. Nature. 2008.
Erratum in
- Nature. 2013 Feb 28;494(7438):506
Abstract
Human cancer cells typically harbour multiple chromosomal aberrations, nucleotide substitutions and epigenetic modifications that drive malignant transformation. The Cancer Genome Atlas (TCGA) pilot project aims to assess the value of large-scale multi-dimensional analysis of these molecular characteristics in human cancer and to provide the data rapidly to the research community. Here we report the interim integrative analysis of DNA copy number, gene expression and DNA methylation aberrations in 206 glioblastomas--the most common type of adult brain cancer--and nucleotide sequence aberrations in 91 of the 206 glioblastomas. This analysis provides new insights into the roles of ERBB2, NF1 and TP53, uncovers frequent mutations of the phosphatidylinositol-3-OH kinase regulatory subunit gene PIK3R1, and provides a network view of the pathways altered in the development of glioblastoma. Furthermore, integration of mutation, DNA methylation and clinical treatment data reveals a link between MGMT promoter methylation and a hypermutator phenotype consequent to mismatch repair deficiency in treated glioblastomas, an observation with potential clinical implications. Together, these findings establish the feasibility and power of TCGA, demonstrating that it can rapidly expand knowledge of the molecular basis of cancer.
Figures
Figure 1. Significant copy number aberrations and pattern of somatic mutations
(a) Frequency and significance of focal high-level copy-number alterations. Known and putative target genes are listed for each significant CNA, with “Number of Genes” denoting the total number of genes within each focal CNA boundary. (b–c) Distribution of the number of (b) silent and (c) non-silent mutations across the 91 GBM samples separated according to their treatment status, showing hypermutation in 7 out of the 19 treated samples. (d) Significantly mutated genes in 91 glioblastomas. The eight genes attaining a false discovery rate <0.1 are displayed here. Somatic mutations occurring in untreated samples are in dark blue; those found in statistically non-hypermutated and hypermutated samples among the treated cohort are in respectively lighter shades of blue.
Figure 2. Mutations in NF1 tumor suppressor gene and EGFR family members
(a) NF1 somatic mutations in 91 glioblastoma tumors. Both missense mutations and truncating nonsense, frameshift, and splice site mutations were observed. Splice positions are given in number of bases to the closest exon (e#) numbered according to the NF1 reference transcript in the Human Gene Mutation Database; positive = 3′ of exon, negative = 5′ of exon. *: stop codon. fs: frameshift. (b) Correlation of copy number and mutation status at the NF1 locus with level of expression (Y axis). Mutation events predicted to result in fewer expressed copies (including deletion, nonsense, splice site, and frameshift mutations) generally have lower observed expression. HomoDel = homozygous deletion; HemiDel = single-copy loss; Neutral = no change in copy number (presumed diploid); Amp = increased copy number. Copy number status of the NF1 locus in each sample was determined as described in the Supplementary Information. (c). DNA Copy number and mRNA expression profiles for TCGA samples TCGA-08–0356 (red), TCGA-02–0064 (blue), and TCGA-02–0529 (green) at the EGFR locus. The upper panel shows the segmented DNA copy number (based on Affymetrix SNP6.0 data) versus genomic coordinates on chromosome 7. The lower panel shows relative exon expression levels across the known EGFR exons from the Affymetrix Exon array ordered by genomic position, where relative expression is the median-centered difference in exon intensity and gene intensity. The EGFR gene model lies between the two plots. Black lines map the genomic positions of exons 2 through 7 and 26 through 28. Note that structural deletions cause the relatively lower expression of exons 2–7 in the green and blue samples and exons 26–28 in the red sample. (d) ERBB2 somatic mutations in 91 glioblastoma tumors. Mutations cluster in the extracellular domain in both genes. Splice site mutation position is given in number of bases to the closest exon (e#); positive = 3′ of exon.
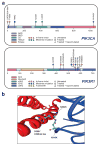
Figure 3. PIK3R1 and PIK3CA mutations in GBM
(a). Diamonds above the backbone indicate the locations of mutations found in TCGA tumors. ABD: adaptor binding domain; RDB: Ras binding domain; C2: membrane-binding domain; iSH2: intervening domain. (b). Four mutations found in the interaction interface of the p110α; C2 domain with iSH2 of p85 α. Two residues of p85 α, D560 and N564, are within hydrogen-bonding distance of the C2 residue of p110 α, N345.
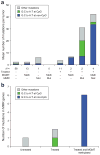
Figure 4. Pattern of somatic mutations, MGMT DNA methylation, and MMR gene mutations in treated GBMs
(a). The mean number of validated somatic nucleotide substitutions per tumor for key sample groups is indicated on the Y-axis and denoted by the height of the bar histograms. Samples are grouped along the X-axis according to treatment status of the patient (− = untreated; + = treated), DNA methylation status of MGMT (meth = DNA methylated; − = not methylated), and genetic status of MMR genes − = no genes mutated and mut = one or more of the MLH1, MSH2, MSH6, or PMS2 genes mutated); the number below each bar indicates the number of samples in the group. Bars are color-coded for types of nucleotide substitutions including G-to-A transitions at non-CpG sites (orange), G-to-A transitions at CpG sites (blue), and other mutation types (green). (b). Bar histogram for mutation spectrum in the MMR genes as a function of treatment status, and methylation status of MGMT. The color code for substitution types is the same as in (a).
Figure 5. Frequent genetic alterations in three critical signaling pathways
Primary sequence alterations and significant copy number changes for components of the (a) RTK/RAS/PI-3K, (b) p53, and (c) RB signaling pathways are shown. Red indicates activating genetic alterations, with frequently altered genes showing deeper shades of red. Conversely, blue indicates inactivating alterations, with darker shades corresponding to a higher percentage of alteration. For each altered component of a particular pathway, the nature of the alteration and the percentage of affected tumors affected are indicated. Blue boxes contain the final percentages of glioblastomas with alterations in at least one known component gene of the designated pathway.
Similar articles
- Molecular differences in IDH wildtype glioblastoma according to MGMT promoter methylation.
Kessler T, Sahm F, Sadik A, Stichel D, Hertenstein A, Reifenberger G, Zacher A, Sabel M, Tabatabai G, Steinbach J, Sure U, Krex D, Grosu AL, Bewerunge-Hudler M, Jones D, Pfister SM, Weller M, Opitz C, Bendszus M, von Deimling A, Platten M, Wick W. Kessler T, et al. Neuro Oncol. 2018 Feb 19;20(3):367-379. doi: 10.1093/neuonc/nox160. Neuro Oncol. 2018. PMID: 29016808 Free PMC article. - Prognostic value of MGMT promoter methylation and TP53 mutation in glioblastomas depends on IDH1 mutation.
Wang K, Wang YY, Ma J, Wang JF, Li SW, Jiang T, Dai JP. Wang K, et al. Asian Pac J Cancer Prev. 2014;15(24):10893-8. doi: 10.7314/apjcp.2014.15.24.10893. Asian Pac J Cancer Prev. 2014. PMID: 25605197 - The combination of IDH1 mutations and MGMT methylation status predicts survival in glioblastoma better than either IDH1 or MGMT alone.
Molenaar RJ, Verbaan D, Lamba S, Zanon C, Jeuken JW, Boots-Sprenger SH, Wesseling P, Hulsebos TJ, Troost D, van Tilborg AA, Leenstra S, Vandertop WP, Bardelli A, van Noorden CJ, Bleeker FE. Molenaar RJ, et al. Neuro Oncol. 2014 Sep;16(9):1263-73. doi: 10.1093/neuonc/nou005. Epub 2014 Feb 6. Neuro Oncol. 2014. PMID: 24510240 Free PMC article. - TP53 Mutation and Extraneural Metastasis of Glioblastoma: Insights From an Institutional Experience and Comprehensive Literature Review.
Zhang X, Katsakhyan L, LiVolsi VA, Roth JJ, Rassekh CH, Bagley SJ, Nasrallah MP. Zhang X, et al. Am J Surg Pathol. 2021 Nov 1;45(11):1516-1526. doi: 10.1097/PAS.0000000000001762. Am J Surg Pathol. 2021. PMID: 34366423 Review. - Molecular profiling in glioblastoma: prelude to personalized treatment.
Mladkova N, Chakravarti A. Mladkova N, et al. Curr Oncol Rep. 2009 Jan;11(1):53-61. doi: 10.1007/s11912-009-0009-3. Curr Oncol Rep. 2009. PMID: 19080742 Review.
Cited by
- EGFR and c-Met Cross Talk in Glioblastoma and Its Regulation by Human Cord Blood Stem Cells.
Velpula KK, Dasari VR, Asuthkar S, Gorantla B, Tsung AJ. Velpula KK, et al. Transl Oncol. 2012 Oct;5(5):379-92. doi: 10.1593/tlo.12235. Epub 2012 Oct 1. Transl Oncol. 2012. PMID: 23066446 Free PMC article. - Combined drug action of 2-phenylimidazo[2,1-b]benzothiazole derivatives on cancer cells according to their oncogenic molecular signatures.
Furlan A, Roux B, Lamballe F, Conti F, Issaly N, Daian F, Guillemot JF, Richelme S, Contensin M, Bosch J, Passarella D, Piccolo O, Dono R, Maina F. Furlan A, et al. PLoS One. 2012;7(10):e46738. doi: 10.1371/journal.pone.0046738. Epub 2012 Oct 5. PLoS One. 2012. PMID: 23071625 Free PMC article. - Identifying dysfunctional miRNA-mRNA regulatory modules by inverse activation, cofunction, and high interconnection of target genes: a case study of glioblastoma.
Xiao Y, Ping Y, Fan H, Xu C, Guan J, Zhao H, Li Y, Lv Y, Jin Y, Wang L, Li X. Xiao Y, et al. Neuro Oncol. 2013 Jul;15(7):818-28. doi: 10.1093/neuonc/not018. Epub 2013 Mar 20. Neuro Oncol. 2013. PMID: 23516263 Free PMC article. - Integrative genomic analyses reveal clinically relevant long noncoding RNAs in human cancer.
Du Z, Fei T, Verhaak RG, Su Z, Zhang Y, Brown M, Chen Y, Liu XS. Du Z, et al. Nat Struct Mol Biol. 2013 Jul;20(7):908-13. doi: 10.1038/nsmb.2591. Epub 2013 Jun 2. Nat Struct Mol Biol. 2013. PMID: 23728290 Free PMC article. - HOTAIR is a therapeutic target in glioblastoma.
Zhou X, Ren Y, Zhang J, Zhang C, Zhang K, Han L, Kong L, Wei J, Chen L, Yang J, Wang Q, Zhang J, Yang Y, Jiang T, Li M, Kang C. Zhou X, et al. Oncotarget. 2015 Apr 10;6(10):8353-65. doi: 10.18632/oncotarget.3229. Oncotarget. 2015. PMID: 25823657 Free PMC article.
References
- Furnari FB, et al. Malignant astrocytic glioma: genetics, biology, and paths to treatment. Genes Dev. 2007;21:2683–710. - PubMed
- Mischel PS, Nelson SF, Cloughesy TF. Molecular analysis of glioblastoma: pathway profiling and its implications for patient therapy. Cancer Biol Ther. 2003;2:242–7. - PubMed
- Phillips HS, et al. Molecular subclasses of high-grade glioma predict prognosis, delineate a pattern of disease progression, and resemble stages in neurogenesis. Cancer Cell. 2006;9:157–73. - PubMed
- Maher EA, et al. Marked genomic differences characterize primary and secondary glioblastoma subtypes and identify two distinct molecular and clinical secondary glioblastoma entities. Cancer Res. 2006;66:11502–13. - PubMed
Publication types
MeSH terms
Substances
Grants and funding
- U24CA126561/CA/NCI NIH HHS/United States
- U24CA126551/CA/NCI NIH HHS/United States
- R01 CA099041/CA/NCI NIH HHS/United States
- U54HG003067/HG/NHGRI NIH HHS/United States
- U24 CA143848/CA/NCI NIH HHS/United States
- U24 CA126546/CA/NCI NIH HHS/United States
- U54 HG003067/HG/NHGRI NIH HHS/United States
- U54HG003273/HG/NHGRI NIH HHS/United States
- U24CA126543/CA/NCI NIH HHS/United States
- U24CA126554/CA/NCI NIH HHS/United States
- U24CA126544/CA/NCI NIH HHS/United States
- U24 CA126551/CA/NCI NIH HHS/United States
- T32 GM007753/GM/NIGMS NIH HHS/United States
- U54 HG003273/HG/NHGRI NIH HHS/United States
- U54HG003079/HG/NHGRI NIH HHS/United States
- U24 CA126554/CA/NCI NIH HHS/United States
- K08 NS045077/NS/NINDS NIH HHS/United States
- U24 CA126561/CA/NCI NIH HHS/United States
- U24 CA126543/CA/NCI NIH HHS/United States
- U24CA126563/CA/NCI NIH HHS/United States
- U24CA126546/CA/NCI NIH HHS/United States
- U54 HG003079/HG/NHGRI NIH HHS/United States
- U24 CA126563/CA/NCI NIH HHS/United States
- U24 CA126544/CA/NCI NIH HHS/United States
LinkOut - more resources
Full Text Sources
Other Literature Sources
Medical
Molecular Biology Databases
Research Materials
Miscellaneous


