Systems-level metabolic flux profiling identifies fatty acid synthesis as a target for antiviral therapy - PubMed (original) (raw)
. 2008 Oct;26(10):1179-86.
doi: 10.1038/nbt.1500. Epub 2008 Sep 28.
Affiliations
- PMID: 18820684
- PMCID: PMC2825756
- DOI: 10.1038/nbt.1500
Systems-level metabolic flux profiling identifies fatty acid synthesis as a target for antiviral therapy
Joshua Munger et al. Nat Biotechnol. 2008 Oct.
Abstract
Viruses rely on the metabolic network of their cellular hosts to provide energy and building blocks for viral replication. We developed a flux measurement approach based on liquid chromatography-tandem mass spectrometry to quantify changes in metabolic activity induced by human cytomegalovirus (HCMV). This approach reliably elucidated fluxes in cultured mammalian cells by monitoring metabolome labeling kinetics after feeding cells (13)C-labeled forms of glucose and glutamine. Infection with HCMV markedly upregulated flux through much of the central carbon metabolism, including glycolysis. Particularly notable increases occurred in flux through the tricarboxylic acid cycle and its efflux to the fatty acid biosynthesis pathway. Pharmacological inhibition of fatty acid biosynthesis suppressed the replication of both HCMV and influenza A, another enveloped virus. These results show that fatty acid synthesis is essential for the replication of two divergent enveloped viruses and that systems-level metabolic flux profiling can identify metabolic targets for antiviral therapy.
Figures
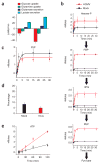
Figure 1
Flux profiling of uninfected and HCMV-infected cells. (a) Measurement of influxes and effluxes of selected metabolites (per 1.5 × 10⁶ cells; mean + 2 s.e.; n ≥ 3). Negative values are influxes, and positive ones effluxes. (b) Intracellular accumulation of 13C-labeled glycolytic metabolites (hexose-P, glucose-6-phosphate and its isomers; FBP, fructose-1,6-bisphosphate; 3PG, 3-phosphoglycerate; PEP, phosphoenolpyruvate) after switching 1.5 × 10⁶ cells into uniformly 13C-labeled glucose medium. Symbols indicate experimental data points ± 2 s.e.; n = 4; lines indicate model output. (c) Labeling dynamics, as in b, for the PPP intermediate pentose-P (ribose-5-phosphate and its isomers). (d) Percentage of labeled lactate containing one 13C atom after feeding of [1,2-13C]glucose. This is indicative of the PPP:glycolytic flux ratio; nonoxidative PPP flux yields lactate containing one 13C atom, whereas glycolytic flux does not. Data are shown as means + 2 s.e.; n = 3). (e) Labeling dynamics, as in b and c, for ATP. The bulk of observed labeling came from the ribose moiety of ATP. Similar results were found for GTP, UTP and CTP.
Figure 2
Profiling of TCA cycle fluxes in uninfected and HCMV-infected cells. (a) Intracellular accumulation of 13C-labeled citrate after transfer of 1.5 × 10⁶ cells to uniformly 13C-labeled glucose medium. Symbols indicate experimental data points ± 2 s.e.; n = 4; lines indicate model output. (b) Details of citrate labeling kinetics and patterns after transfer of 1.5 × 10⁶ mock-infected cells to uniformly 13C-labeled glucose medium. Symbols indicate experimental data points ± 2 s.e.; n = 4; lines indicate model output. (c) Comparable data to b, but for HCMV-infected cells. (d) Labeling dynamics, as in a, for malate. (e) Extent of 13C-labeling (partial or complete) of the indicated TCA cycle metabolites after 2 h of exposure to uniformly 13C-labeled glucose in uninfected and virally infected cells (mean + 2 s.e.; n = 4). (f) Comparable data to e, but for labeling with uniformly 13C-labeled glutamine (n = 2). (g) Schematic of labeling patterns induced by citrate shuttle with feeding of uniformly 13C-labeled glucose. The pattern corresponds well to viral labeling data in a–e. The unlabeled portion of acetyl-CoA comes from CoA, which was omitted from the diagram for simplicity.
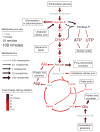
Figure 3
Metabolite concentrations and fluxes in uninfected and HCMV-infected confluent human fibroblasts. Font sizes indicate metabolite pool sizes (per 1.5 × 10⁶ cells) in uninfected fibroblasts. Arrow sizes indicate net fluxes (per 1.5 × 10⁶ cells) in uninfected fibroblasts. Colors indicate fold changes in response to HCMV infection. All scales are logarithmic. Fluxes shown are median values (Supplementary Table 5) from the 100 flux sets shown in Supplementary Tables 6 and 7. An exception to the proportionality of font size and pool size is malonyl-CoA, the concentration of which was too small to depict by font size. Metabolites whose levels were not directly measured are shown in gray italics. Amino acids are named by standard three-letter codes. Hexose-P, glucose-6-phosphate and its isomers; FBP, fructose-1,6-bisphosphate; DHAP, dihydroxyacetone phosphate; 3PG, 3-phosphoglycerate; PEP, phosphoenolpyruvate; AKG, α-ketoglutarate; OAA, oxaloacetate.
Figure 4
HCMV induces lipogenesis. (a) Raw LC-MS/MS chromatograms of malonyl-CoA in uninfected (black) and virally infected (red) cells. (b,c) Production of 14C-labeled lipids from [14C]glucose in uninfected and HCMV-infected fibroblasts. Data are shown separately for the fatty acid (b) and glycerol (c) portions of saponified lipids (mean + s.e.; n = 3).
Figure 5
Effect of pharmacological inhibitors of fatty acid biosynthesis on HCMV and influenza replication. (a) Production of infectious HCMV virions 96 h after infection (MOI, 3.0 PFU per cell) in the presence of carrier (DMSO), the ACC inhibitor TOFA or the FAS inhibitor C75 (mean + s.e., n = 4). (b) Accumulation of the HCMV IE1 protein (the primary isoform is ~75 kDa), UL26 (two isoforms) and pp28 in the presence of carrier, C75 (10 μg ml−1) or TOFA (10 μg ml−1) at an MOI of 3.0 PFU per cell. Tubulin levels are indicated as a control for protein loading. (c) Production of infectious influenza A virions 24 h after infection (MOI, 0.1 PFU per cell) in the presence of carrier, TOFA (50 μg ml−1) or C75 (10 μg ml−1). Data are shown as mean + s.e.; n = 4).
Comment in
- From biomarkers to integrated network responses.
Sauer U, Zamboni N. Sauer U, et al. Nat Biotechnol. 2008 Oct;26(10):1090-2. doi: 10.1038/nbt1008-1090. Nat Biotechnol. 2008. PMID: 18846075 No abstract available.
Similar articles
- Human Cytomegalovirus pUL37x1 Is Important for Remodeling of Host Lipid Metabolism.
Xi Y, Harwood S, Wise LM, Purdy JG. Xi Y, et al. J Virol. 2019 Oct 15;93(21):e00843-19. doi: 10.1128/JVI.00843-19. Print 2019 Nov 1. J Virol. 2019. PMID: 31391267 Free PMC article. - From biomarkers to integrated network responses.
Sauer U, Zamboni N. Sauer U, et al. Nat Biotechnol. 2008 Oct;26(10):1090-2. doi: 10.1038/nbt1008-1090. Nat Biotechnol. 2008. PMID: 18846075 No abstract available. - Viral effects on metabolism: changes in glucose and glutamine utilization during human cytomegalovirus infection.
Yu Y, Clippinger AJ, Alwine JC. Yu Y, et al. Trends Microbiol. 2011 Jul;19(7):360-7. doi: 10.1016/j.tim.2011.04.002. Epub 2011 May 12. Trends Microbiol. 2011. PMID: 21570293 Free PMC article. Review. - Kinome Profiling Identifies Druggable Targets for Novel Human Cytomegalovirus (HCMV) Antivirals.
Arend KC, Lenarcic EM, Vincent HA, Rashid N, Lazear E, McDonald IM, Gilbert TS, East MP, Herring LE, Johnson GL, Graves LM, Moorman NJ. Arend KC, et al. Mol Cell Proteomics. 2017 Apr;16(4 suppl 1):S263-S276. doi: 10.1074/mcp.M116.065375. Epub 2017 Feb 25. Mol Cell Proteomics. 2017. PMID: 28237943 Free PMC article. - Metabolomics in drug target discovery.
Rabinowitz JD, Purdy JG, Vastag L, Shenk T, Koyuncu E. Rabinowitz JD, et al. Cold Spring Harb Symp Quant Biol. 2011;76:235-46. doi: 10.1101/sqb.2011.76.010694. Epub 2011 Nov 23. Cold Spring Harb Symp Quant Biol. 2011. PMID: 22114327 Free PMC article. Review.
Cited by
- Dengue and metabolomics in humans.
Romagnolo AG, Carvalho KI. Romagnolo AG, et al. Metabolomics. 2021 Mar 12;17(3):34. doi: 10.1007/s11306-021-01783-6. Metabolomics. 2021. PMID: 33712974 Review. - Palmitic Acid Promotes Virus Replication in Fish Cell by Modulating Autophagy Flux and TBK1-IRF3/7 Pathway.
Yu Y, Li C, Liu J, Zhu F, Wei S, Huang Y, Huang X, Qin Q. Yu Y, et al. Front Immunol. 2020 Aug 5;11:1764. doi: 10.3389/fimmu.2020.01764. eCollection 2020. Front Immunol. 2020. PMID: 32849631 Free PMC article. - Human cytomegalovirus induces neuronal enolase to support virally mediated metabolic remodeling.
Moreno I Jr, Rodríguez-Sánchez I, Schafer X, Munger J. Moreno I Jr, et al. Proc Natl Acad Sci U S A. 2022 Dec 6;119(49):e2205789119. doi: 10.1073/pnas.2205789119. Epub 2022 Dec 2. Proc Natl Acad Sci U S A. 2022. PMID: 36459650 Free PMC article. - Overcoming nutrient limitations for cell-based production of influenza vaccine.
Liu XP, Huang D, Tan WS, Luo J, Chen Z. Liu XP, et al. Hum Vaccin Immunother. 2015;11(7):1685-8. doi: 10.1080/21645515.2015.1044182. Hum Vaccin Immunother. 2015. PMID: 26061797 Free PMC article. - Switching Host Metabolism as an Approach to Dampen SARS-CoV-2 Infection.
Soliman S, Faris ME, Ratemi Z, Halwani R. Soliman S, et al. Ann Nutr Metab. 2020;76(5):297-303. doi: 10.1159/000510508. Epub 2020 Sep 18. Ann Nutr Metab. 2020. PMID: 32950986 Free PMC article. Review.
References
- Fiehn O. Metabolomics–the link between genotypes and phenotypes. Plant Mol Biol. 2002;48:155–171. - PubMed
- Nicholson JK, Connelly J, Lindon JC, Holmes E. Metabonomics: a platform for studying drug toxicity and gene function. Nat Rev Drug Discov. 2002;1:153–161. - PubMed
- Wikoff WR, Gangoiti JA, Barshop BA, Siuzdak G. Metabolomics identifies perturbations in human disorders of propionate metabolism. Clin Chem. 2007;53:2037–2039. - PubMed
Publication types
MeSH terms
Substances
Grants and funding
- AI068678/AI/NIAID NIH HHS/United States
- R01 CA082396/CA/NCI NIH HHS/United States
- CA85786/CA/NCI NIH HHS/United States
- 5 P50 GM071508/GM/NIGMS NIH HHS/United States
- R01 CA085786/CA/NCI NIH HHS/United States
- P50 GM071508/GM/NIGMS NIH HHS/United States
- CA82396/CA/NCI NIH HHS/United States
- R01 AI078063/AI/NIAID NIH HHS/United States
LinkOut - more resources
Full Text Sources
Other Literature Sources


